6. Indexgestützte Aktienauswahlstrategie
Referenzquelle: docs/_joinquant_migration_source/Example_06_index-enhanced stock selection.ipynb Erste Markdown-Zelle.
Diese Strategie bildet die im CSI 300 enthaltenen Aktien mit einer Gewichtung von über 0,35 % anhand einer anfänglichen Gewichtung von 0,8 ab. Der prozentuale Anteil jeder einzelnen Aktie wird wie folgt berechnet: (0,8 * Gewichtung der enthaltenen Aktie) * 100 %. Anschließend wird, je nachdem, ob eine Aktie 1. fünf Tage in Folge gestiegen oder 2. fünf Tage in Folge gefallen ist, entschieden, ob es sich um eine starke oder schwache Aktie handelt. Ihre Gewichtung wird entsprechend von 0,8 auf 1,0 oder 0,6 angepasst.
Häufigkeit der Strategieausführung: Täglich; Zeitpunkt der Strategieausführung: Vor Börsenschluss jeden Tag.
Der Backtesting-Zeitraum erstreckte sich vom 1. Januar 2021 bis zum 31. Dezember 2022.
6.1. 1. 策略代码
Erstellen Sie individuelle Handelsstrategien:
import qteasy as qt
import numpy as np
from qteasy import Parameter, StgData


class IndexEnhancement(qt.GeneralStg):

    def __init__(self):
        super().__init__(
                pars=[
                    Parameter((0.01, 0.99), name='weight_threshold', par_type='float', value=0.35),
                    Parameter((0.51, 0.99), name='init_weight', par_type='float', value=0.8),
                    Parameter((2, 20), name='price_days', par_type='int', value=5),
                ],
                name='IndexEnhancement',
                description='跟踪HS300指数选股,并根据连续上涨/下跌趋势判断强弱势以增强权重',
                data_types=[
                    StgData('wt_idx|000300.SH', freq='m', asset_type='E', window_length=2),
                    StgData('close', freq='d', asset_type='E', window_length=40),
                ],
        )

    def realize(self):
        weight_threshold, init_weight, price_days = self.get_pars('weight_threshold', 'init_weight', 'price_days')
        # 读取投资组合的权重wt和最近price_days天的收盘价
        wt = self.get_data('wt_idx|000300.SH_E_m')[-1]
        close_windows = self.get_data('close_E_d')
        pre_close = close_windows[-price_days - 1:-1]
        close = close_windows[-price_days:]  # 当前所有股票的最新连续收盘价

        # 计算连续price_days天的收益
        stock_returns = close - pre_close

        # 设置初始选股权重为0.8
        weights = init_weight * np.ones_like(wt)

        # 剔除掉权重小于weight_threshold的股票
        weights[wt < weight_threshold] = 0

        # 找出强势股,将其权重设为1, 找出弱势股,将其权重设置为 init_weight - (1 - init_weight)
        up_trends = np.all(stock_returns > 0, axis=1)
        weights[up_trends] = 1.0
        down_trend_weight = init_weight - (1 - init_weight)
        down_trends = np.all(stock_returns < 0, axis=1)
        weights[down_trends] = down_trend_weight

        # 实际选股权重为weights * HS300权重
        weights *= wt

        return weights
6.2. 2. 策略回测
Backtesting-Parameter:
Backtesting-Zeitraum: 1. Januar 2021 bis 31. Dezember 2022
Anlageart: Aktien
Vermögenspool: Aktien des CSI 300
Anfangskapital: 1 Million
Kaufmenge: 100 Aktien
Verkaufsmenge: 1 Stück
shares = qt.filter_stock_codes(index='000300.SH', date='20210101')
print(len(shares), shares[:10])
alpha = IndexEnhancement()
op = qt.Operator(alpha, signal_type='PT')
op.op_type = 'stepwise'
op.set_blender('1.0*s0')
res = qt.run(op, mode=1,
       invest_start='20210101',
       invest_end='20221231',
       invest_cash_amounts=[1000000],
       asset_type='E',
       asset_pool=shares,
       trade_batch_size=100,
       sell_batch_size=1,
       trade_log=True,
      )

print()
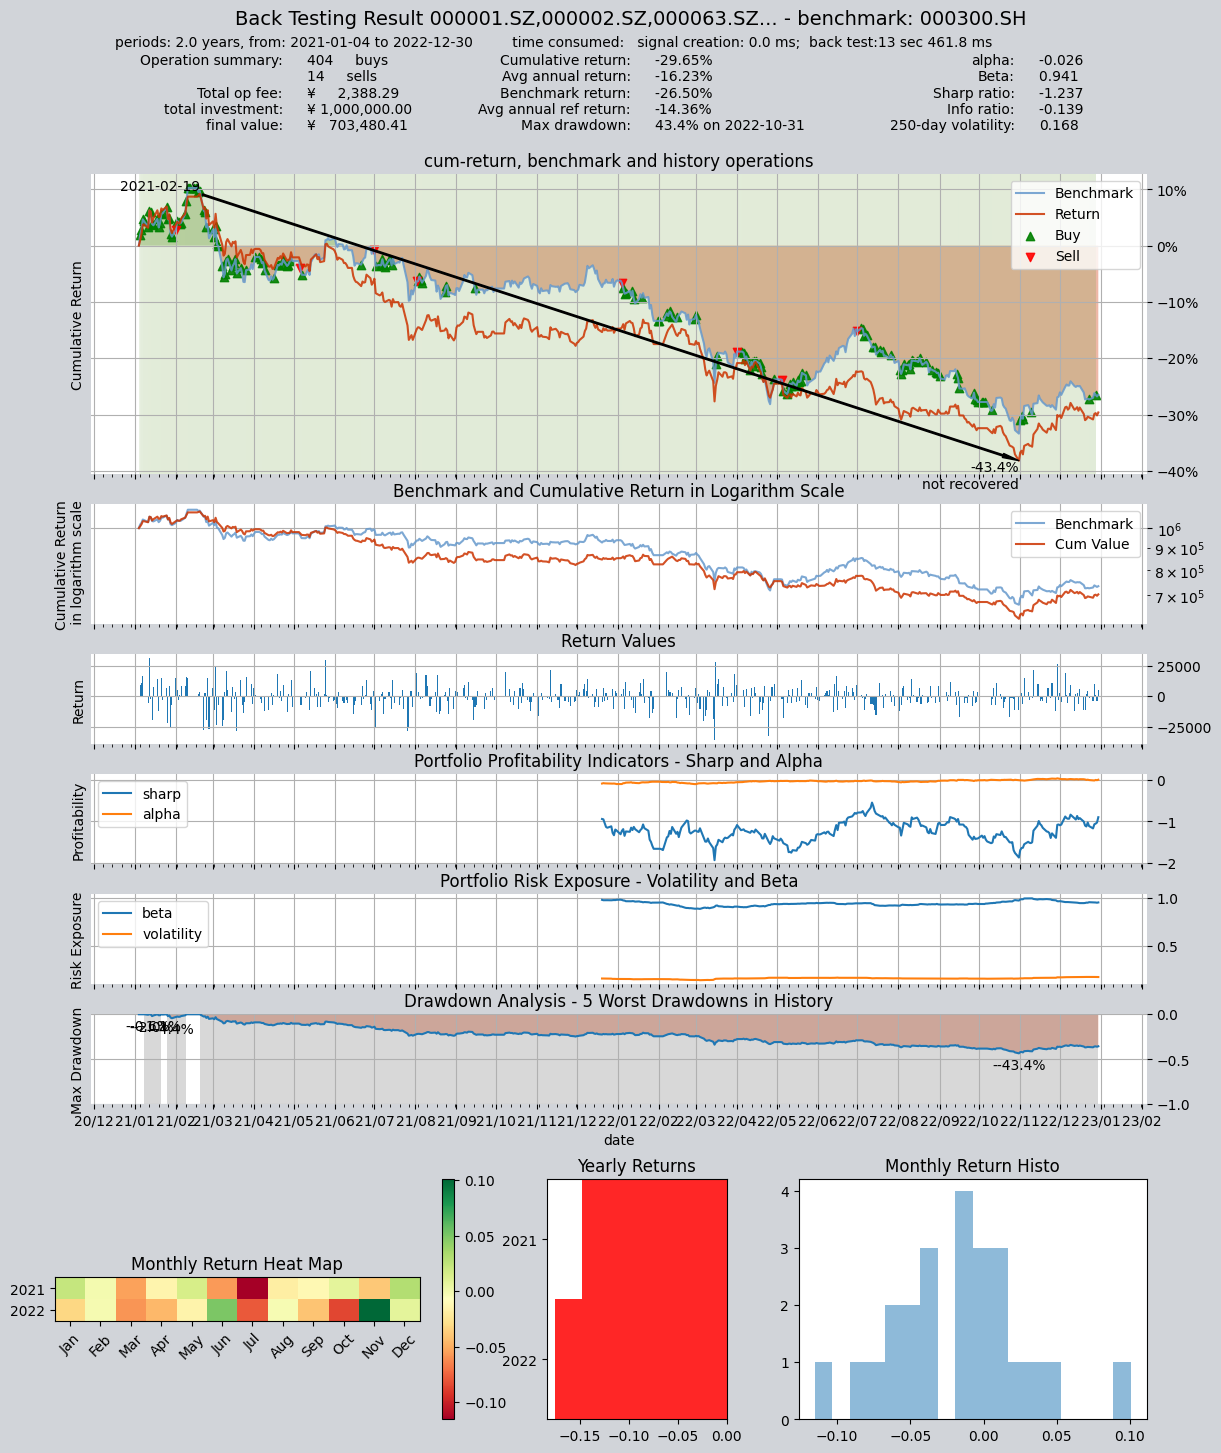
6.3. Backtesting-Ergebnisse
419 ['000001.SZ', '000002.SZ', '000063.SZ', '000066.SZ', '000069.SZ', '000100.SZ', '000157.SZ', '000166.SZ', '000333.SZ', '000338.SZ']
No match found! To get better result, you can
- pass "match_full_name=True" to match full names of stocks and funds

     ====================================
     |                                  |
     |       BACK TESTING RESULT        |
     |                                  |
     ====================================

qteasy running mode: 1 - History back testing
time consumption for operate signal creation: 0.0 ms
time consumption for operation back looping:  13 sec 461.8 ms

investment starts on      2021-01-04 00:00:00
ends on                   2022-12-30 00:00:00
Total looped periods:     2.0 years.

-------------operation summary:------------
Only non-empty shares are displayed, call
"loop_result["oper_count"]" for complete operation summary

          Sell Cnt Buy Cnt Total Long pct Short pct Empty pct
000001.SZ    0         3      3   100.0%     0.0%      0.0%
000002.SZ    0         2      2   100.0%     0.0%      0.0%
000063.SZ    0         0      0   100.0%     0.0%      0.0%
000100.SZ    1         5      6    66.9%     0.0%     33.1%
000333.SZ    0         1      1   100.0%     0.0%      0.0%
000338.SZ    1         1      2    62.3%     0.0%     37.7%
000651.SZ    0         1      1   100.0%     0.0%      0.0%
000725.SZ    0        95     95   100.0%     0.0%      0.0%
000858.SZ    0         0      0   100.0%     0.0%      0.0%
002027.SZ    1         3      4    62.3%     0.0%     37.7%
...            ...     ...   ...      ...       ...       ...
601229.SH    1         3      4    50.2%     0.0%     49.8%
601288.SH    0        76     76   100.0%     0.0%      0.0%
601318.SH    0         3      3   100.0%     0.0%      0.0%
601328.SH    0        30     30   100.0%     0.0%      0.0%
601398.SH    0       106    106   100.0%     0.0%      0.0%
601601.SH    1         0      1    78.8%     0.0%     21.2%
601668.SH    0        15     15   100.0%     0.0%      0.0%
601688.SH    0         1      1   100.0%     0.0%      0.0%
601899.SH    0         4      4   100.0%     0.0%      0.0%
603259.SH    0         0      0   100.0%     0.0%      0.0%

Total operation fee:     ¥    2,388.29
total investment amount: ¥1,000,000.00
final value:              ¥  703,480.41
Total return:                   -29.65%
Avg Yearly return:              -16.23%
Skewness:                         -0.02
Kurtosis:                          1.63
Benchmark return:               -26.50%
Benchmark Yearly return:        -14.36%

------strategy loop_results indicators------
alpha:                           -0.026
Beta:                             0.941
Sharp ratio:                     -1.237
Info ratio:                      -0.139
250 day volatility:               0.168
Max drawdown:                    43.41%
    peak / valley:        2021-02-19 / 2022-10-31
    recovered on:         Not recovered!

===========END OF REPORT=============