2. Acquire and manage financial data
qteasy is a fully locally deployed and run quantitative trading analysis toolkit with the following features:
Acquisition, cleaning, storage, processing, visualization, and use of financial data
Creation of quantitative trading strategies, with a large number of built-in basic trading strategies provided
Vectorized high-speed backtesting of trading strategies and evaluation of trading results
Optimization and evaluation of trading strategy parameters
Deployment and live trading of trading strategies
Through this tutorial series, you will gain a thorough understanding of qteasy’s main features and how to use them through a series of practical examples.
本篇在数据体验路径中的位置:1 安装与配置 → 2.0 下载与取数(本篇) → 2.5 玩数据与因子分析 →(可选 2.6 / 2.7 / 2.8)→ 3 第一个策略回测。
2.1. Preparations before you begin
Before starting this tutorial, please complete the following:
Complete the installation of
qteasyand upgrade to the latest version数据通道(二选一或组合):
使用 Tushare:注册
tushare pro账户并确保有一定的积分(大多数高级数据需要较多积分才能下载),在qteasy.cfg中配置tushare_token使用 AKShare 或其他通道:安装
pip install akshare(若选 AKShare),无需 Tushare token;部分表覆盖范围小于 Tushare,详见数据通道文档
完成
mysql数据库的配置,并将数据库配置写入qteasy.cfg(可选项)Complete the installation of
ta-lib(optional)
In the previous tutorial, I explained how to create a new virtual environment and install and initialize qteasy in it. If you haven’t completed this step yet, please refer to the previous tutorial to finish installing qteasy and the basic configuration.
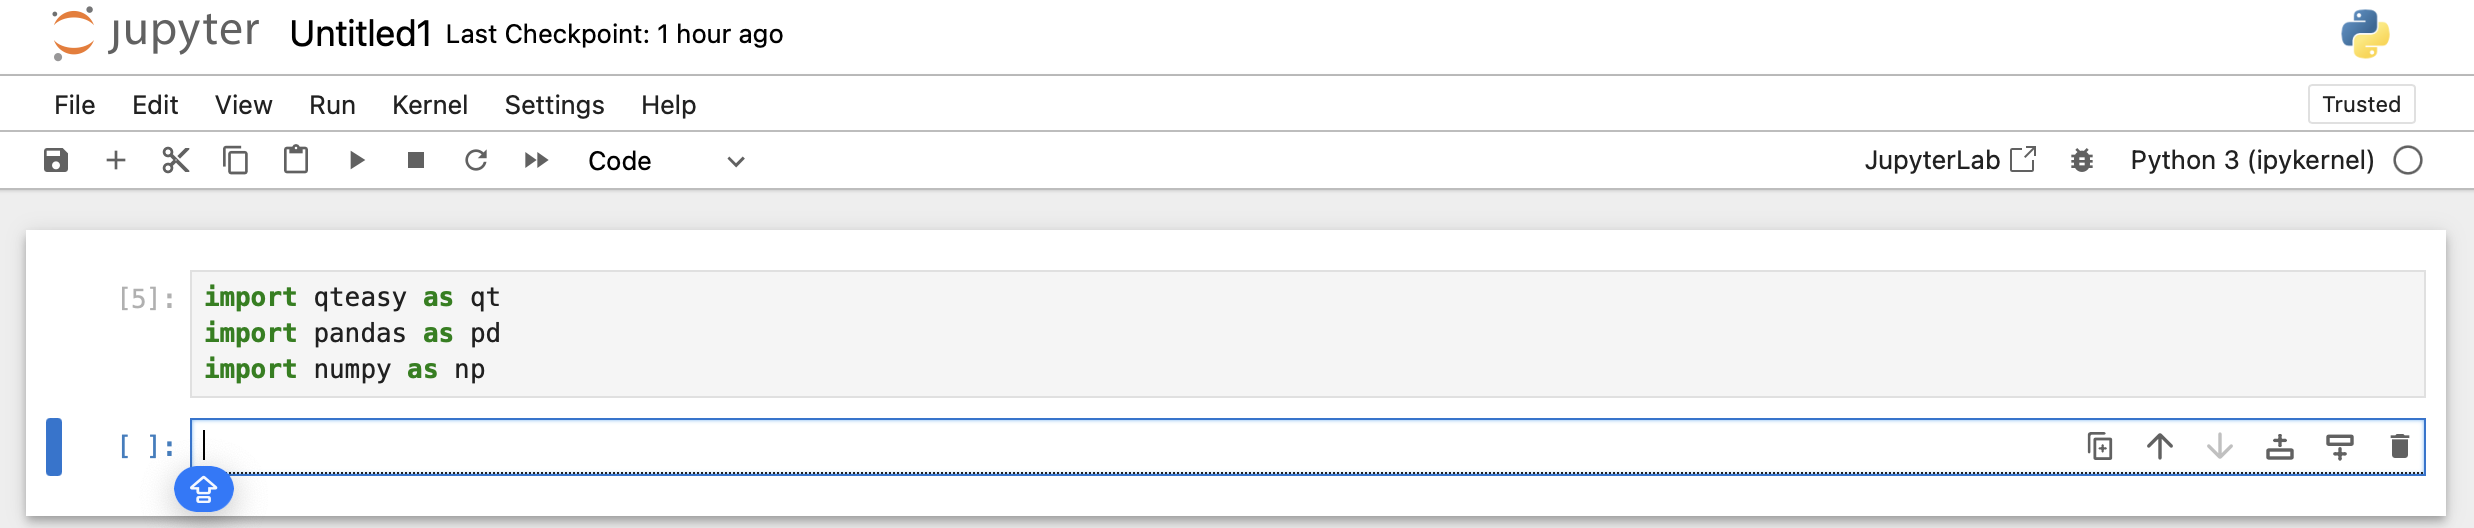
In addition, to make it easier to use features such as charts later on, it is recommended to use jupyter notebook for development. You can run the following command in the newly created virtual environment to install jupyter notebook:
(bash): pip install notebook
After installation is complete, you can use the following command to start jupyter notebook:
(bash): jupyter notebook
After startup, you can run code in an interactive development environment in your browser, as shown in the figure below:
If you don’t use jupyter notebook, you can also use ipython:
(bash): pip install ipython
ipython runs in the terminal, but its support for charts is not as good.
2.2. Obtain basic data and price data
As introduced in the previous tutorial, a newly initialized qteasy cannot access any historical data. All historical data must first be downloaded locally and saved into a data repository called Datasource before you can carry out any subsequent data-dependent work, such as retrieving historical data, backtesting and optimizing strategies, and so on.
qteasy needs to use many types of data. All data is stored in some predefined data tables, and Datasource is a collection of a series of data tables. The most basic data tables include:
trade_calendar- Trading calendar data, including the planned market open and close dates for different exchanges; the trading calendar for the next year is updated at the end of each year.stock_basic- 股票基础信息(文档中有时统称「basics」),包括沪深股市所有股票的基本信息index_basic- 指数基础信息,包括沪深股市所有指数的基本信息
refill_data_source(tables=...)使用数据表名(如stock_basic),与上列一致。
After configuring tushare_token, when you import qteasy for the first time, if the system cannot find trading calendar data, it will display a message indicating that the trading calendar cannot be read.
For more information about the DataSource data source object, see DataSource Reference.
>>> import qteasy as qt
Tip:
UserWarning: trade calendar is not loaded, some utility functions may not work properly, to download trade calendar, run
"qt.refill_data_source(tables='trade_calendar')"
qteasy provides a function get_table_overview() to display information about locally stored data. Running this function prints a list of the data tables saved locally, the amount of data stored, the disk space used, the data range, and so on.
>>> qt.get_table_overview()
The data table analysis process may take a few minutes. During this time, a progress bar will be displayed to show the analysis progress. After the analysis is complete, a list of tables in the local data source will be shown, along with information such as the data range of each table.
If there is no data in the current data source, the following will be output:
Analyzing local data source tables... depending on size of tables, it may take a few minutes
Analyzing completed!
Analyzing tables: 100%|█████████████████████████| 104/104 [00:00<00:00, 9107.58it/s]

Finished analyzing datasource:
file://csv@qt_root/data/
0 table(s) out of 104 contain local data as summary below, to view complete list, print returned DataFrame
===============================tables with local data===============================
Empty DataFrame
Columns: [has_data, size, records, min2, max2]
Index: []
If there is no data in the local data source, the content above will be displayed. In this case, you need to download data to the local data source.
Download the trading calendar and basic data
我们可以调用refill_data_source函数下载交易日历和基础数据。这个函数是qteasy的标准数据下载接口函数,所有的历史数据类型均可以通过此接口下载。这个函数的基本参数是tables,传入数据表的名称即可下载相应的数据到本地存储了。使用refill_data_source下载交易数据时,qteasy会自动进行数据清洗,排除重复数据,去除错误数据,发生错误自动重试,并将下载的数据合并到本地数据表中。
qteasy支持通过 tushare、akshare、eastmoney、sina 等多个内置通道下载数据(参数 channel,未指定时默认为 tushare)。不同通道支持的表范围与前置条件不同,切换方式与能力对照见数据通道文档。
要下载前面提到的交易日历、股票和指数的基本信息,只需要运行下面的代码(默认使用 Tushare,需已配置 tushare_token):
>>> qt.refill_data_source(tables='trade_calendar, stock_basic, index_basic')
During the data download process, a progress bar will be shown to display the download progress.
The output is as follows:
Filling data source file://csv@qt_root/data/ ...
into 3 table(s) (parallely): {'trade_calendar', 'index_basic', 'stock_basic'}
<trade_calendar> 72609 wrn: 100%|███████████████| 8/8 [00:03<00:00,  2.39task/s]
<index_basic> 12456 wrn: 100%|██████████████████| 8/8 [00:00<00:00,  9.68task/s]
<stock_basic> 5484 wrn: 100%|███████████████████| 4/4 [00:00<00:00,  5.45task/s]

Data refill completed! 90549 rows written into 3/3 table(s)!
After the download is complete, run the qt.get_table_overview() function again.
>>> qt.get_table_overview()
You can see that the data has been successfully downloaded locally:
Analyzing local data source tables... depending on size of tables, it may take a few minutes
Analyzing tables: 100%|████████████████████████| 104/104 [00:00<00:00, 967.60it/s]
Analyzing completed!

Finished analyzing datasource:
file://fth@qt_root/data/
3 table(s) out of 104 contain local data as summary below, to view complete list, print returned DataFrame
===============================tables with local data===============================
               Has_data Size_on_disk Record_count Record_start Record_end
table
trade_calendar   True       1.3MB         73K         CFFEX       SZSE
stock_basic      True       651KB          5K          None       None
index_basic      True       1.1MB         12K          None       None
As you can see, the three data tables have already been downloaded to the local data source. The data source type is "file://csv@qt_root/data/" (i.e., the data is stored as csv files under the /data/ path in the qt root directory). It contains three data tables, and the trading calendar range covers through the end of 2024.
View basic data for stocks and indices
After downloading the basic data above, it is recommended to restart the IDE and re-import qteasy. At this point, we can use qteasy to filter and look up stocks/indices.
To look up detailed stock/index information, you can use the get_stock_info() or get_basic_info() function. The two functions have the same functionality: both can look up security information based on the input security code, name, or keywords, and support wildcards or fuzzy search. If the same code corresponds to different qt_codes—for example, stock 000001 represents Ping An Bank, with qt_code: 000001.SZ, while index 000001 represents the SSE Composite Index, with qt_code: 000001.SZ—qteasy will list all security information:
# 通过完整的qt_code获取信息
>>> qt.get_basic_info('000001.SZ')
The output is as follows:
found 1 matches, matched codes are {'E': {'000001.SZ': '平安银行'}, 'count': 1}
More information for asset type E:
------------------------------------------
ts_code       000001.SZ
name               平安银行
area                 深圳
industry             银行
fullname     平安银行股份有限公司
list_status           L
list_date    1991-04-03
-------------------------------------------
More output can be seen in the figure below:
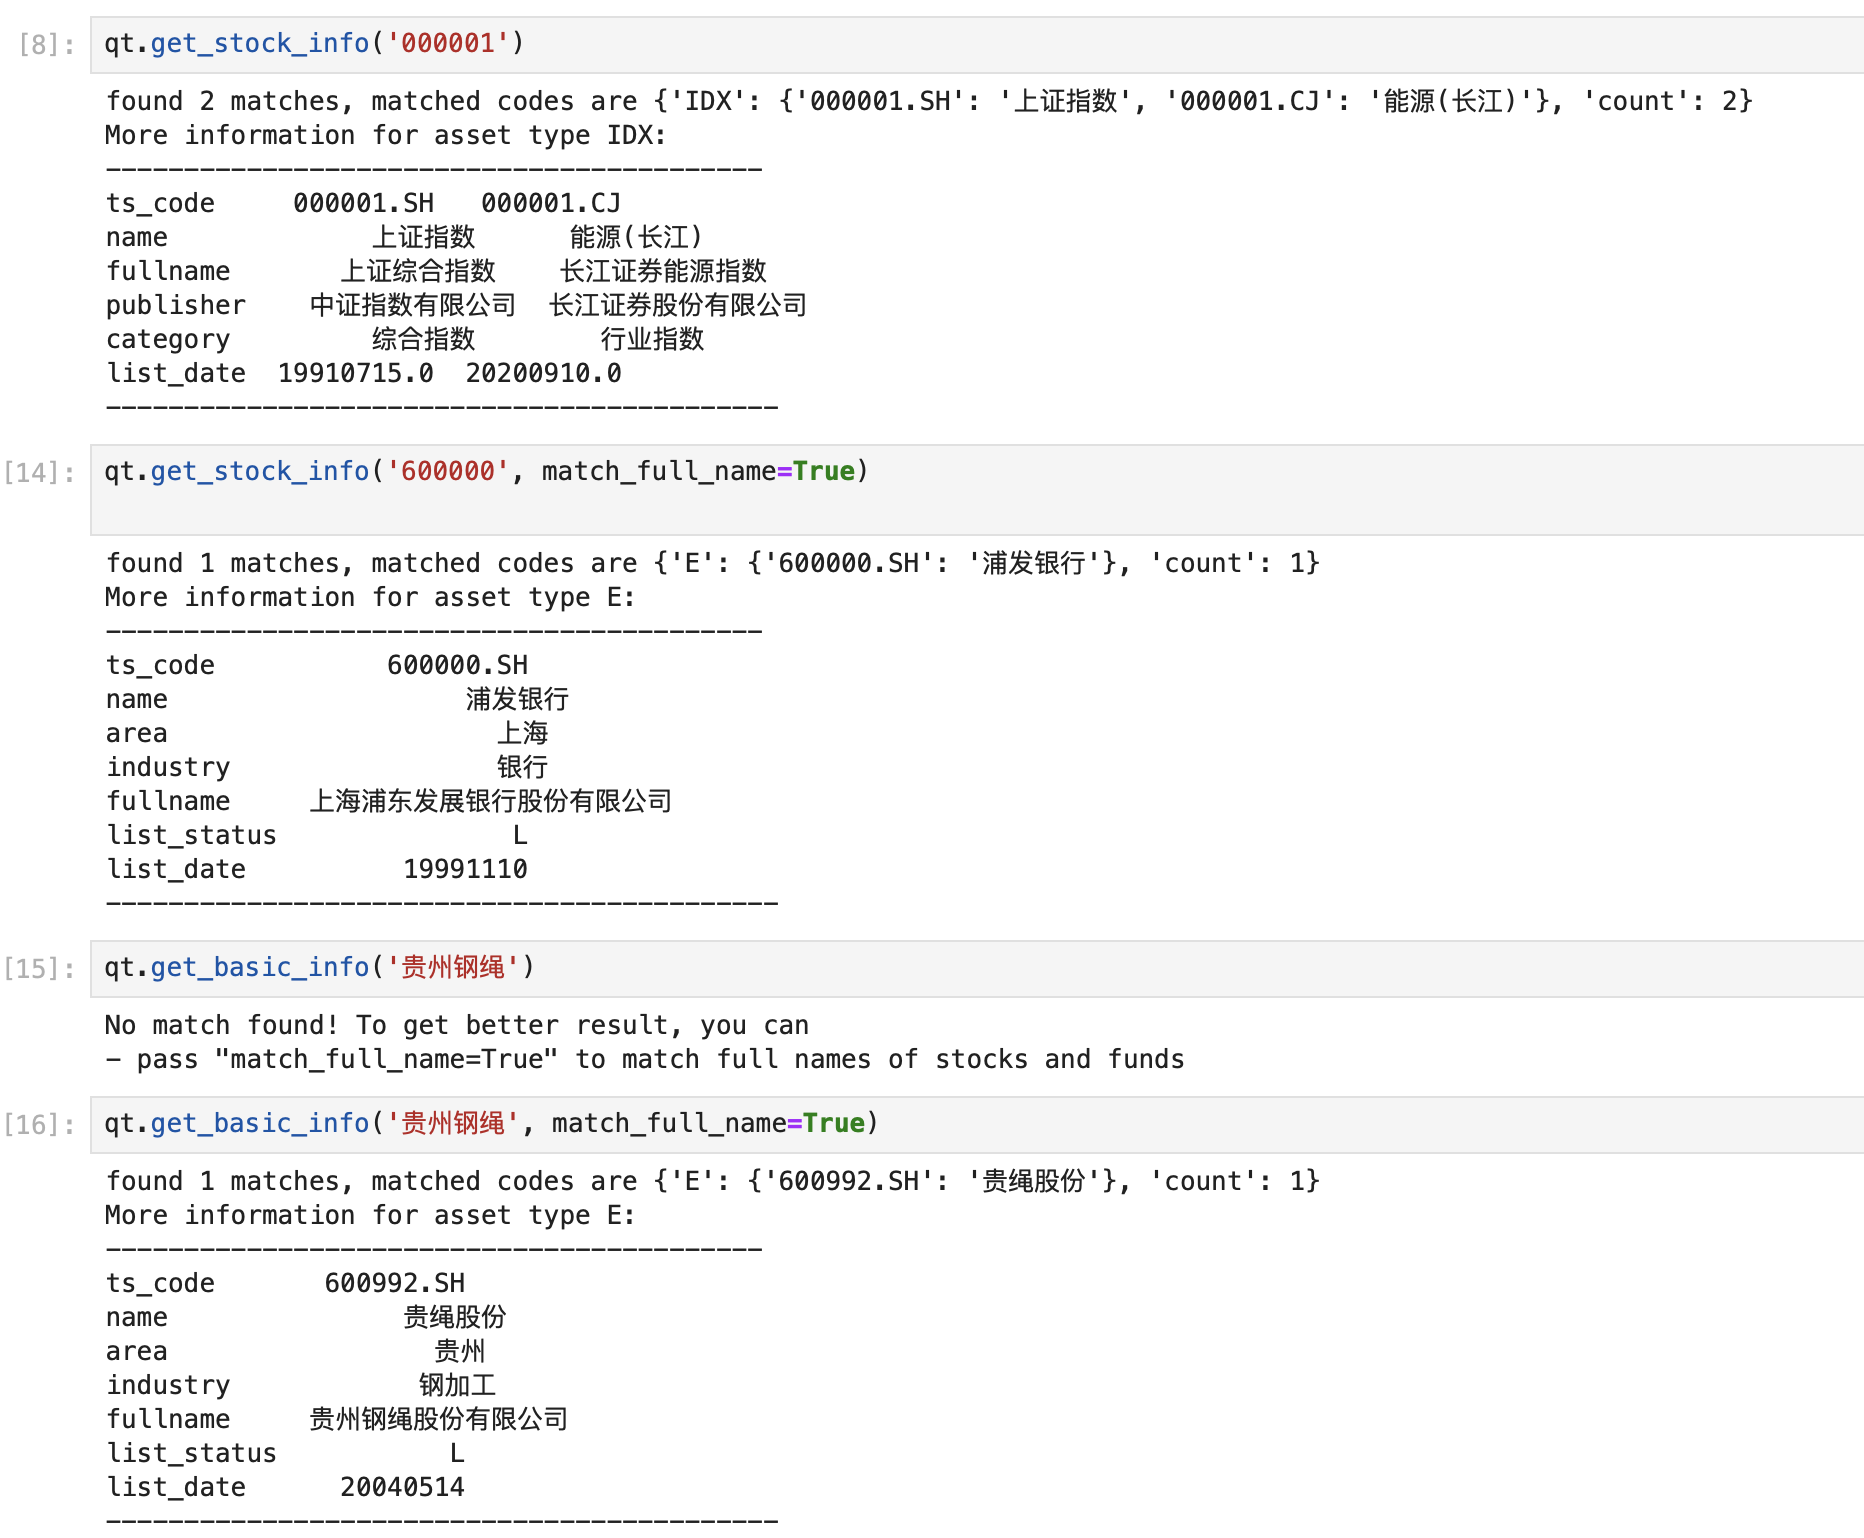
In the example above, the system only found securities of the stock and index types. If you also need to look up more securities information such as funds and futures, you can download more basic data tables in the same way:
fund_basic: Basic fund data
future_basic: Basic futures data
In addition to looking up basic information about stocks or securities, we can also use the qt.filter_stock() function to screen stocks:
>>> qt.filter_stocks(date='20240212', industry='银行', area='上海')
The output is as follows:
           name area industry market  list_date exchange
qt_code
600000.SH  浦发银行   上海       银行     主板 1999-11-10      SSE
601229.SH  上海银行   上海       银行     主板 2016-11-16      SSE
601328.SH  交通银行   上海       银行     主板 2007-05-15      SSE
601825.SH  沪农商行   上海       银行     主板 2021-08-19      SSE
Download Shanghai-listed stock data
Among financial data, the most important type is undoubtedly price and volume data. Next, we will download historical price data.
All historical data in qteasy is stored in data tables in the form of candlestick (K-line) data. The currently supported candlestick data includes:
Minute candlestick charts - 1-minute/5-minute/15-minute/30-minute/60-minute candlestick charts
Daily candlestick chart
Weekly candlestick chart
Monthly candlestick chart
We also use the qt.refill_data_source() function to download stock data. The most commonly used daily stock candlestick (K-line) data is stored in the stock_daily table. However, because the data volume is large, it’s best to limit the data range when downloading. Use the start_date/end_date parameters to specify the start and end dates, and download historical data in batches; otherwise, the download process will be very time-consuming:
>>> qt.refill_data_source(tables='stock_daily', start_date='20230101', end_date='20231231')
The code above downloads daily candlestick (K-line) data for all listed stocks for the entire year of 2023. Likewise, the code below can be used to download daily candlestick (K-line) data for commonly used indices (the SSE Composite Index and the CSI 300 Index):
>>> qt.refill_data_source(tables='index_daily', symbols='000001, 000300', start_date='20231231', end_date='20240208')
Get stock price data from local storage
Once the stock price data is saved locally, you can extract it and use it at any time.
We can use the qt.get_history_data() function to obtain a stock’s price-and-volume data. This function is a general-purpose interface in qteasy and can be used to retrieve various types of data. By specifying the data type (via the data type ID), the stock ticker, and other parameters in the function arguments, you can get the corresponding data. If you want to retrieve the candlestick (K-line) prices you just downloaded, set the data type to "open, high, low, close, vol" to obtain the open, high, low, close, and trading volume:
>>> qt.get_history_data(
...         'open, high, low, close, vol',  # 数据类型,分别为开盘价、最高价、最低价、收盘价、成交量
...         shares='000001.SZ',   # 股票代码:平安银行
...         start='20230101',   # 数据开始日期
...         end='20230301',  # 数据结束日期
... )
The result is as follows:
{'000001.SZ':
              open   high    low  close         vol
 2023-01-04  13.71  14.42  13.63  14.32  2189682.53
 2023-01-05  14.40  14.74  14.37  14.48  1665425.18
 2023-01-06  14.50  14.72  14.48  14.62  1195744.71
 2023-01-09  14.75  14.88  14.52  14.80  1057659.11
 2023-01-10  14.76  14.89  14.39  14.44  1269423.39
 2023-01-11  14.45  14.78  14.39  14.67   830566.12
 2023-01-12  14.77  14.77  14.53  14.67   625694.84
 2023-01-13  14.67  14.95  14.55  14.95   949085.83
 2023-01-16  14.95  15.28  14.85  15.08  1560039.89
 2023-01-17  15.13  15.18  14.77  14.97   935834.54
 2023-01-18  14.95  15.18  14.91  15.11   718434.03
 2023-01-19  15.13  15.25  14.87  15.09   641875.20
 2023-01-20  15.16  15.24  15.00  15.13   608590.08
 2023-01-30  15.60  15.74  14.89  15.15  1374317.50
 2023-01-31  15.24  15.51  14.96  14.99  1030497.84
 2023-02-01  15.03  15.08  14.51  14.70  1653421.48}
The output of the function above is a dictionary: its keys are the tickers of all stocks specified by the shares parameter, and its values are DataFrames containing each stock’s historical data for the specified period. Here we specified the data type as candlestick (K-line) price-and-volume data. Of course, we can also specify other data types—so long as those data have already been downloaded locally, they can be read directly.
For example, specifying the data types htypes='pe, pb, total_mv' lets you obtain three financial indicators such as a stock’s price-to-earnings ratio, price-to-book ratio, and total market capitalization. If some indicators have missing values, you can define a fill method to fill in the missing values. You can also resample the data, converting daily data into weekly or hourly data.
For a detailed explanation of the parameters of the get_history_data function, please refer to the qteasy documentation
Generate a candlestick chart
When using volume and price data, a more convenient and readable approach is to display the data as a candlestick chart.
qteasy provides the qt.candle() function for displaying professional candlestick charts. As long as the data has been downloaded locally, you can display a candlestick chart immediately:
>>> qt.candle('600004.SH', start='20230101', end='20230301')

After downloading the adjustment factor data to your local machine, you can display adjusted prices:
>>> qt.refill_data_source(tables='adj', start_date='20230101', end_date='20230601')
>>> qt.candle('600004.SH', start='20230101', end='20230301', adj='b')
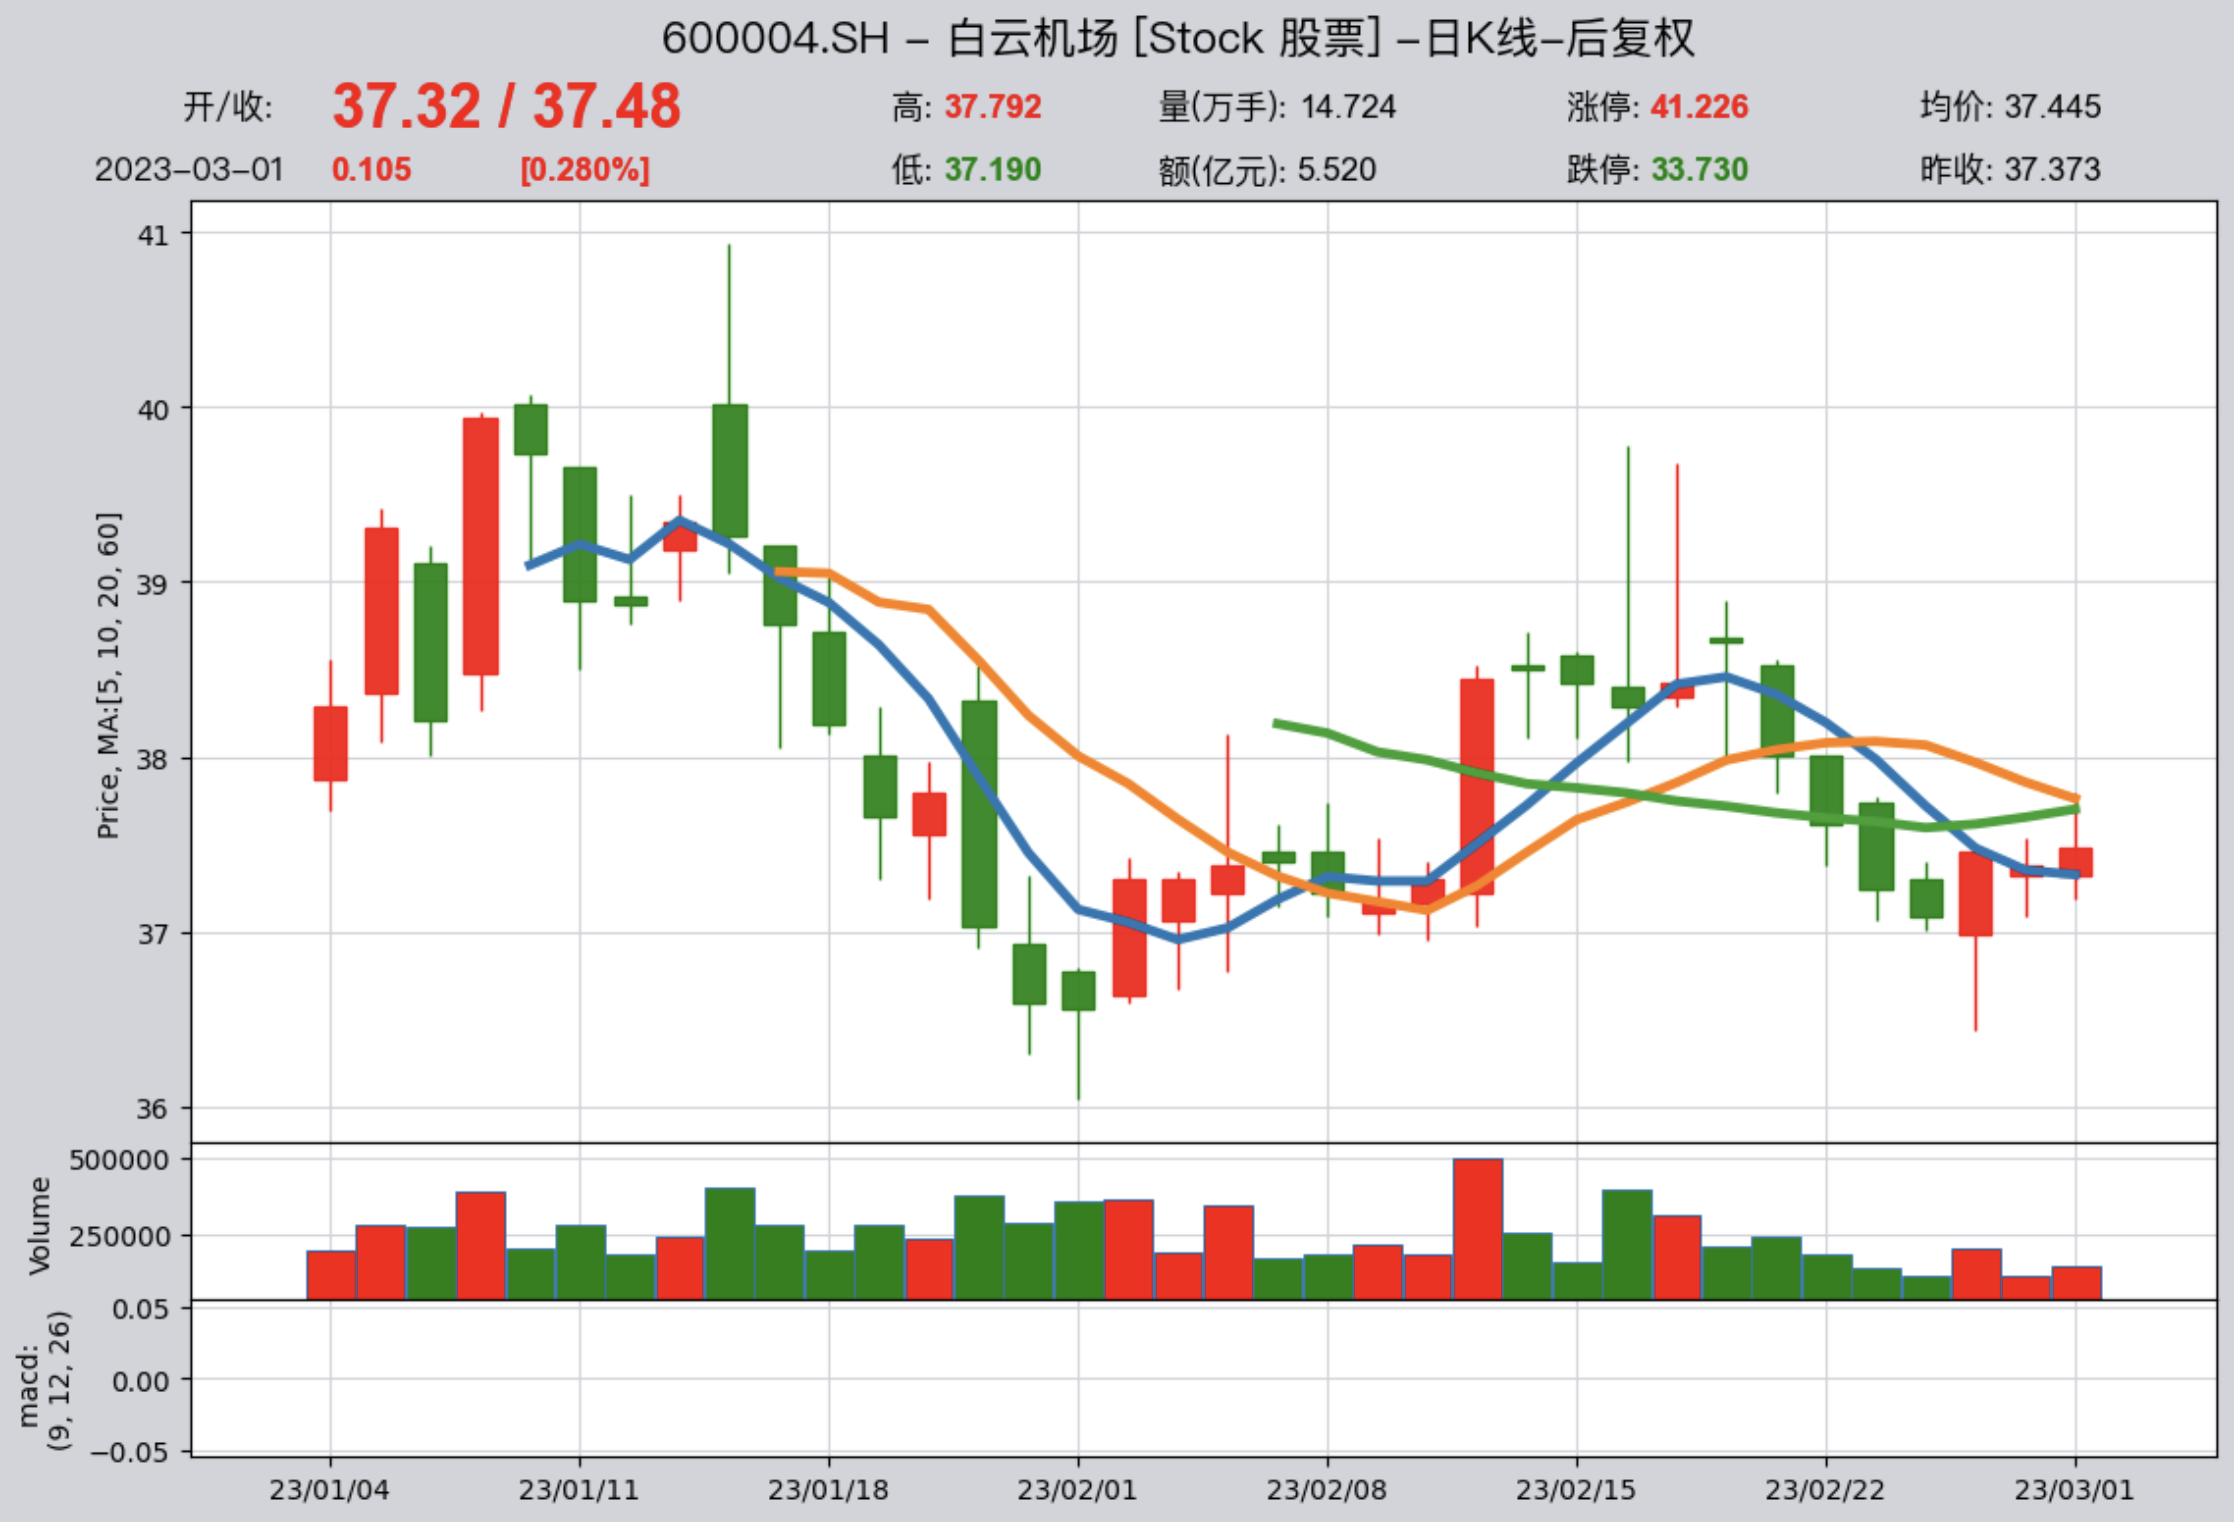
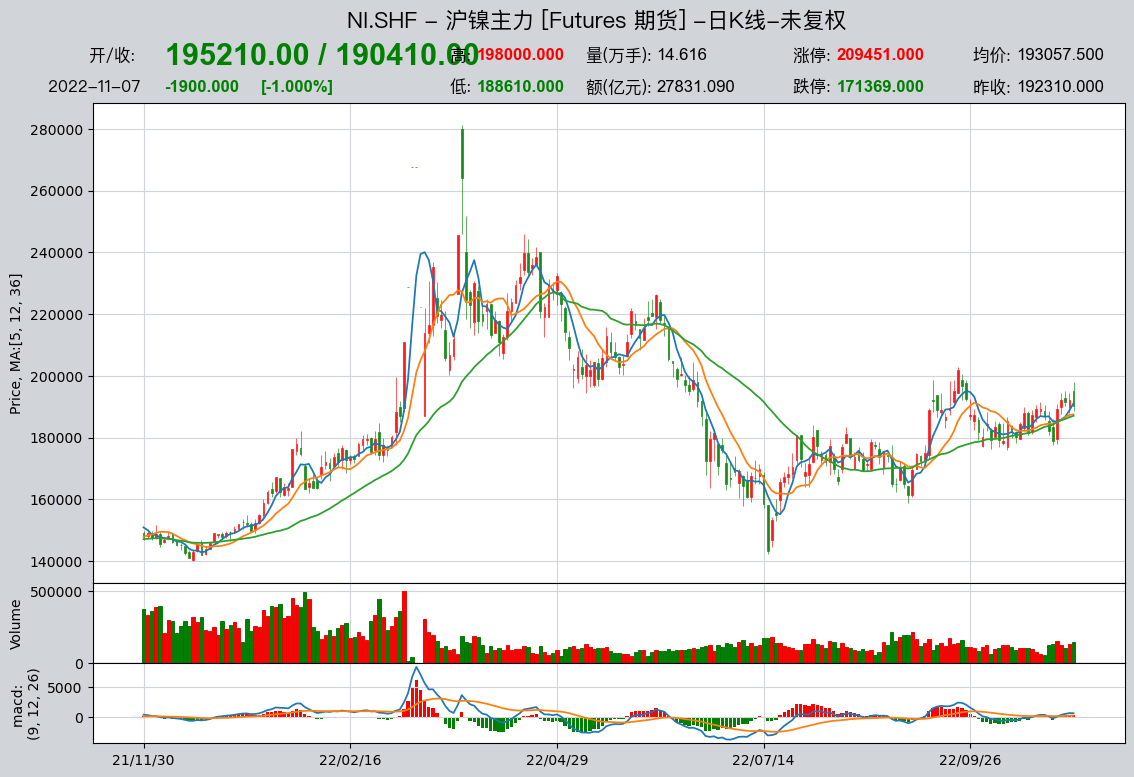
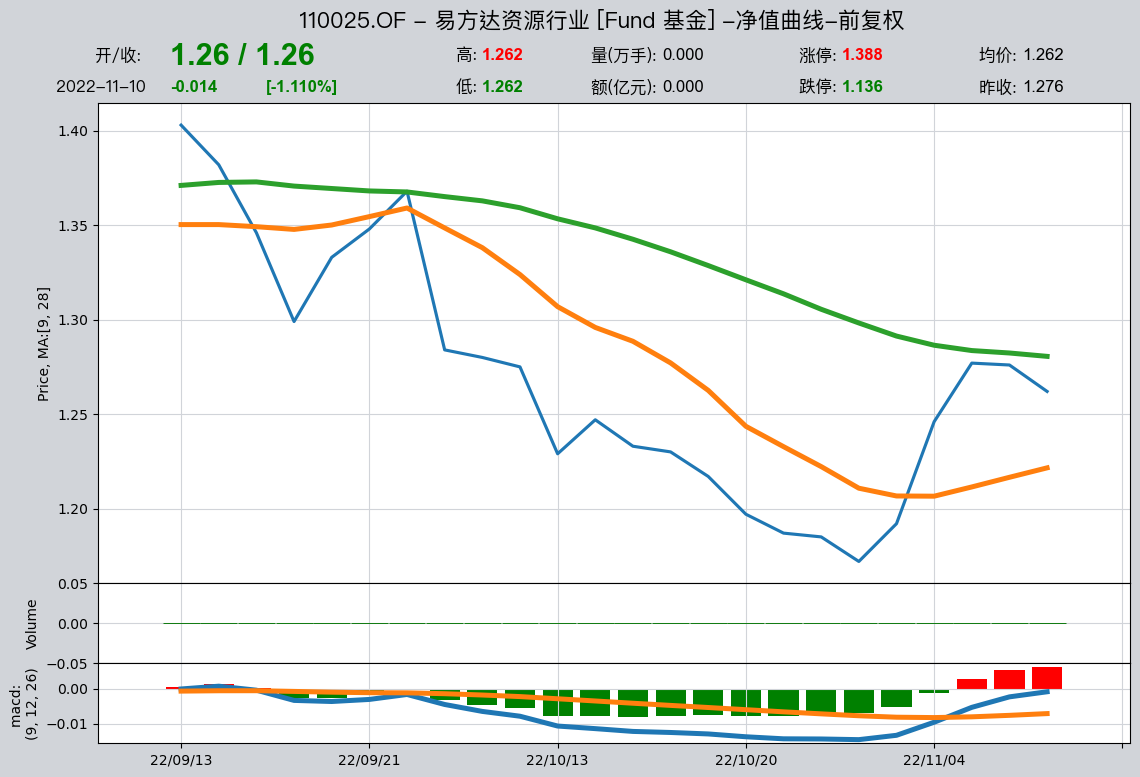
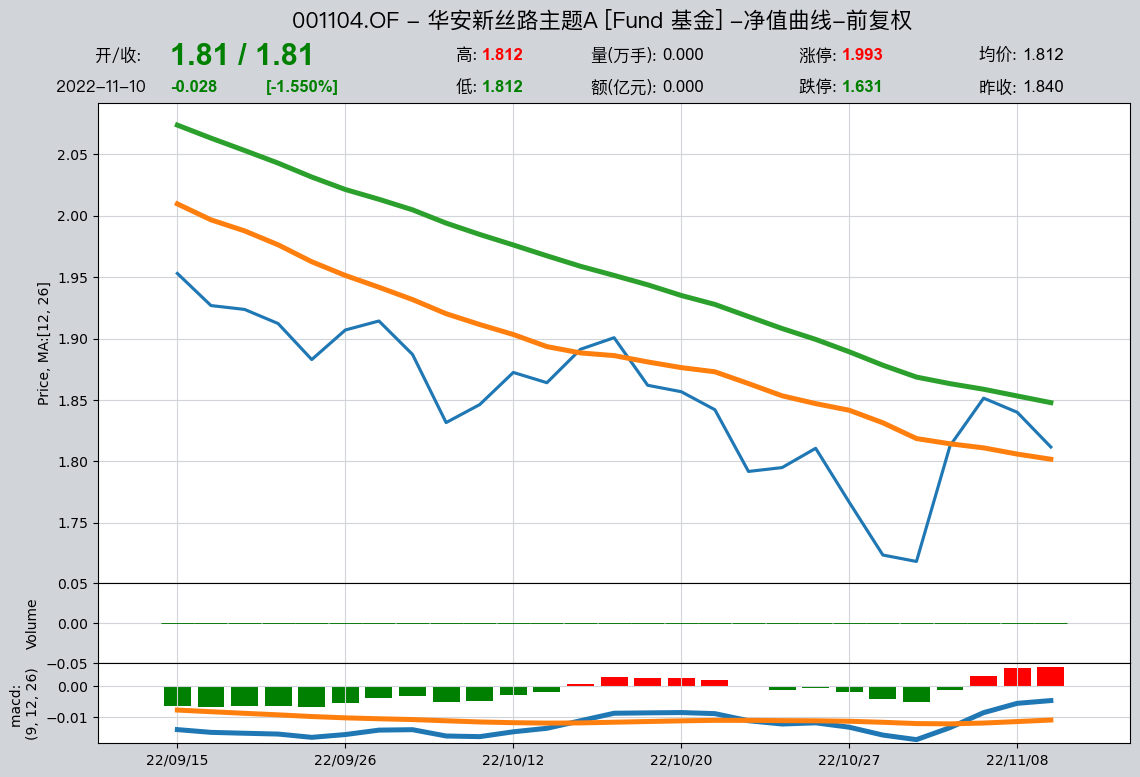
The qt.candle() function supports passing in the start date, end date, candlestick (K-line) frequency, and adjustment method to display candlestick charts for different ranges and frequencies. It also supports passing in the durations of moving averages and different MACD parameters to display different moving averages. In addition, qt.candle() supports displaying candlestick charts by stock name: if the input is a stock name, it will automatically perform a fuzzy search and also supports wildcards.
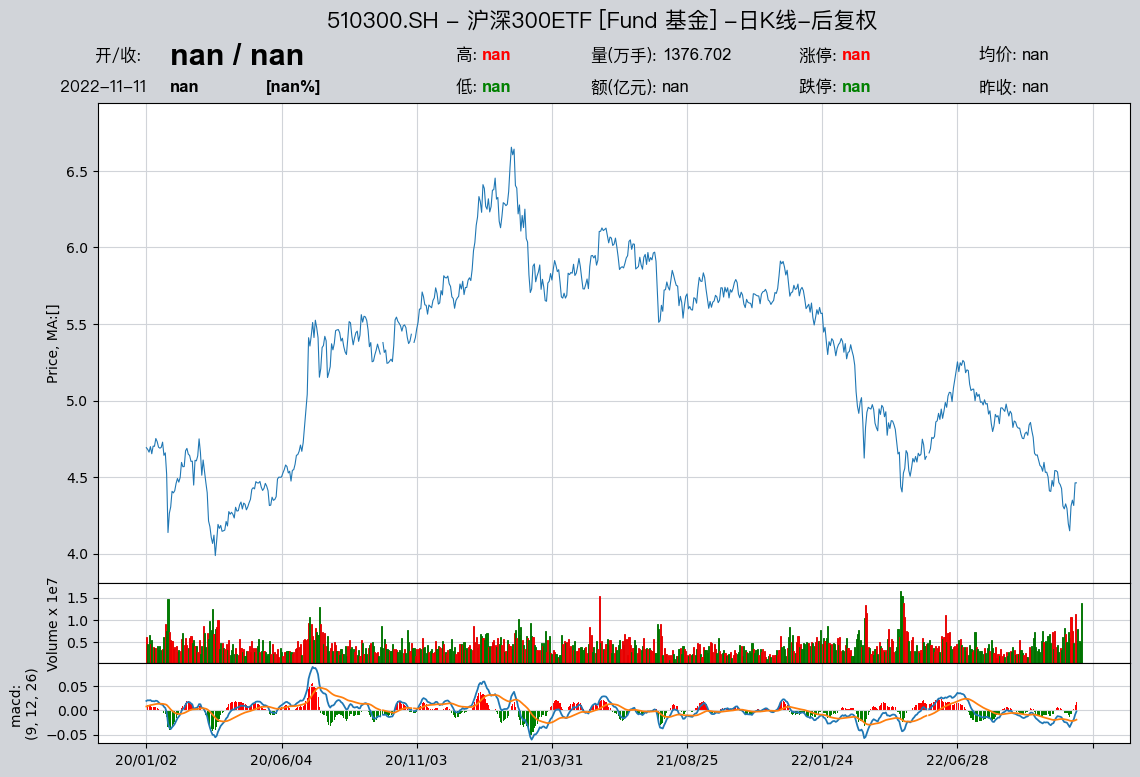
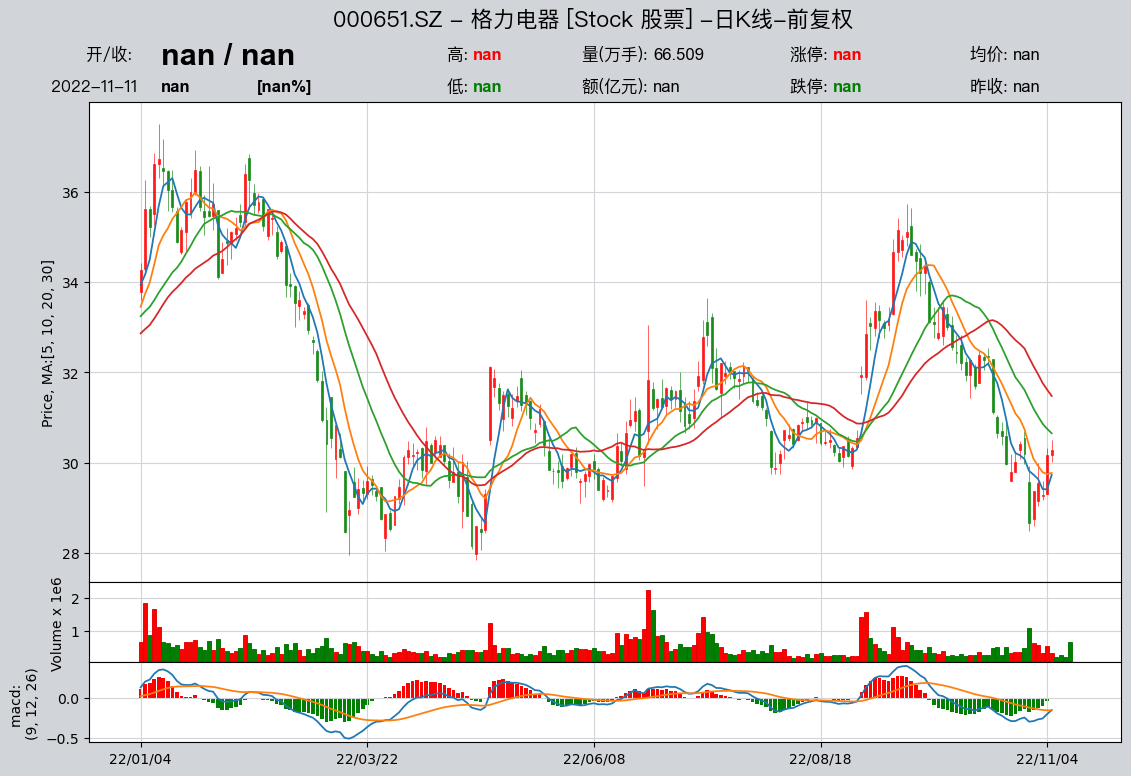
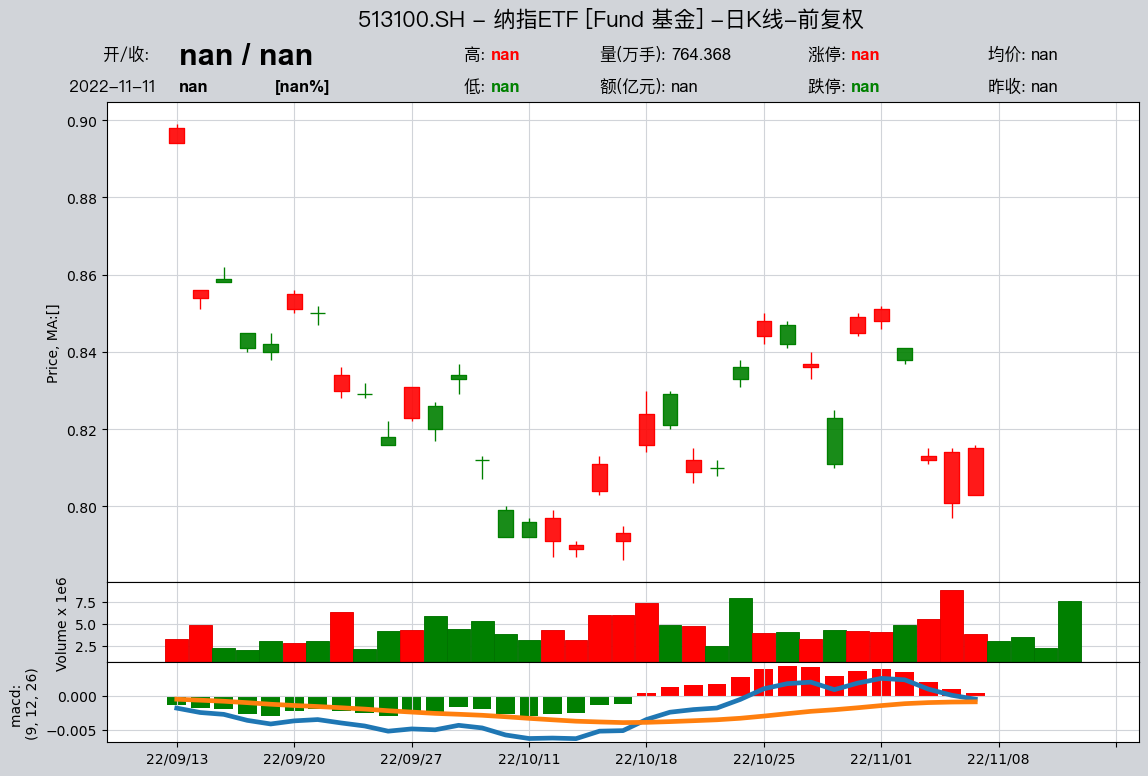
Below are more candlestick chart examples, showing different asset classes such as stocks, funds, and indices; different data frequencies; different moving-average settings; different chart types; and so on. To display the candlestick charts in the examples below, you need to download the corresponding data.
>>> import qteasy as qt
>>> df = qt.candle('159601', start='20210420', freq='d')
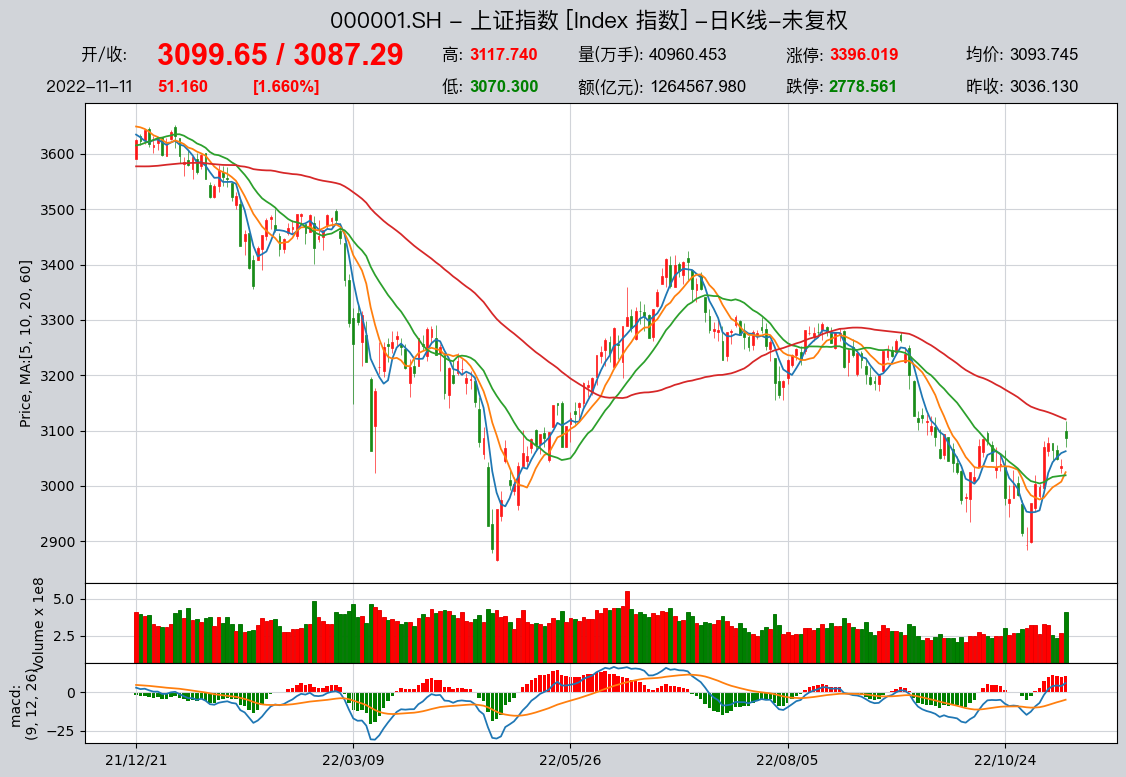
>>> df = qt.candle('000001.SH', start = '20211221', asset_type='IDX', plot_type='c')
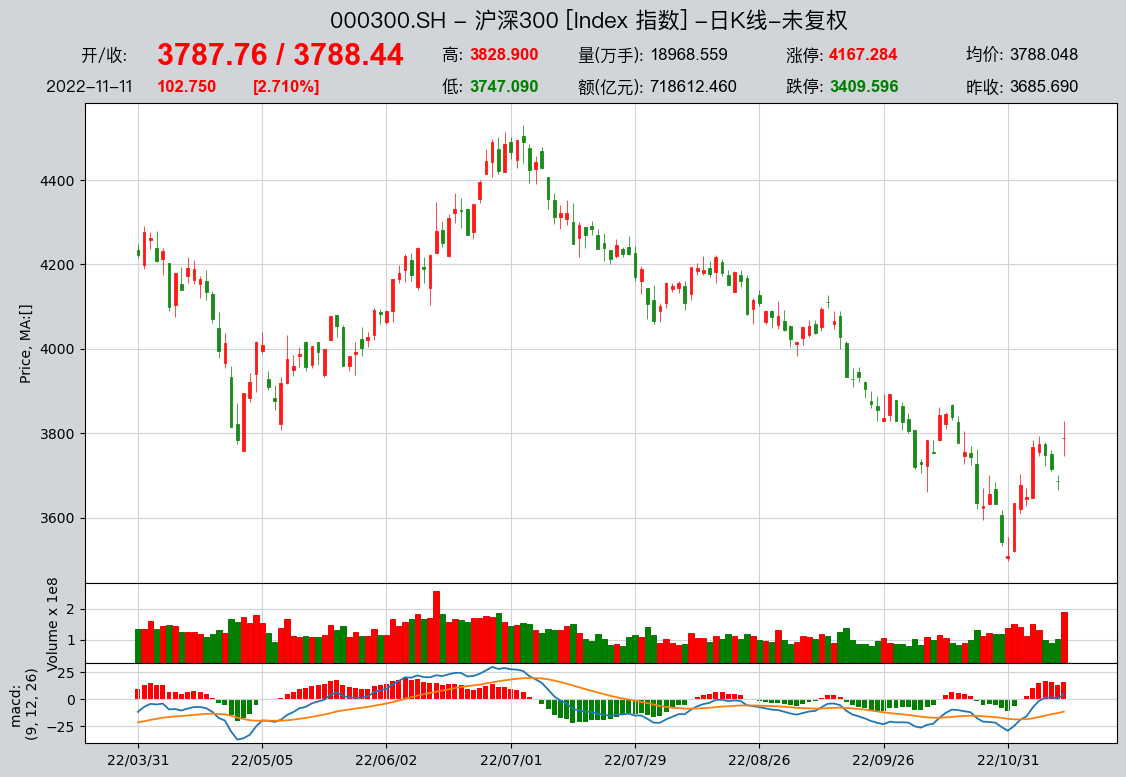
>>> df = qt.candle('000300.SH', start = '20220331', asset_type='IDX', mav=[], plot_type='c')
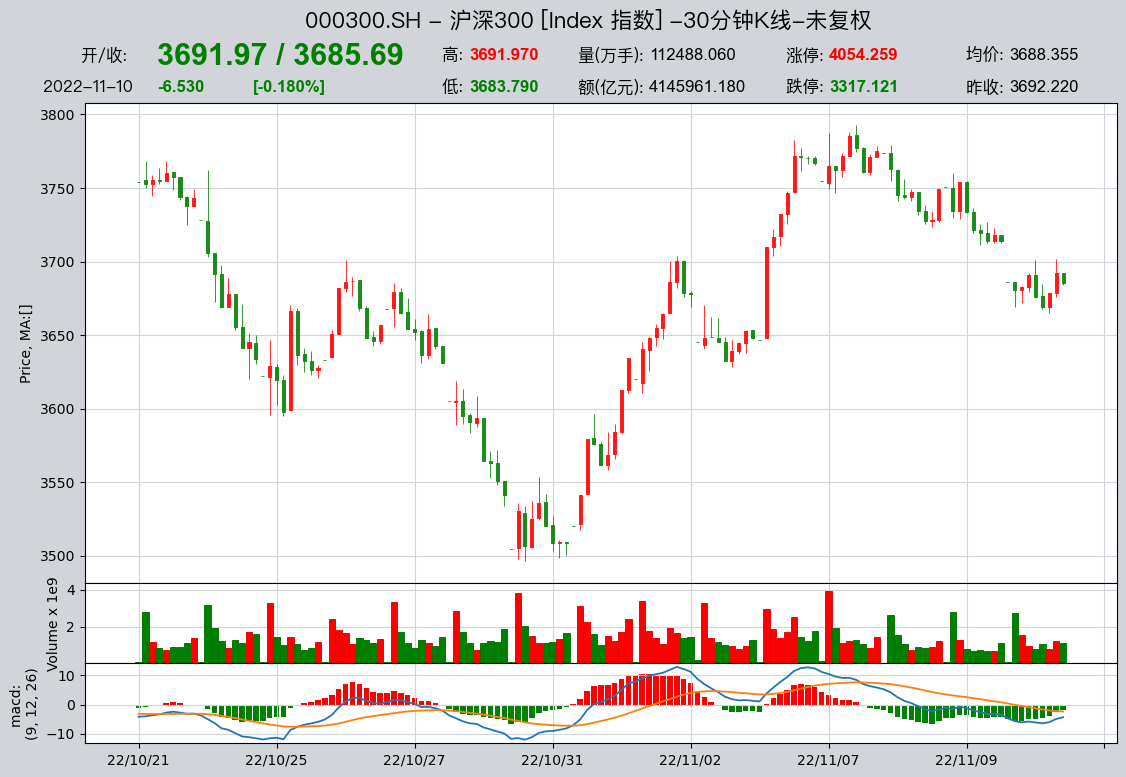
>>> df = qt.candle('000300.SH', start = '20221021', asset_type='IDX', mav=[], plot_type='c',
>>> freq='30min')
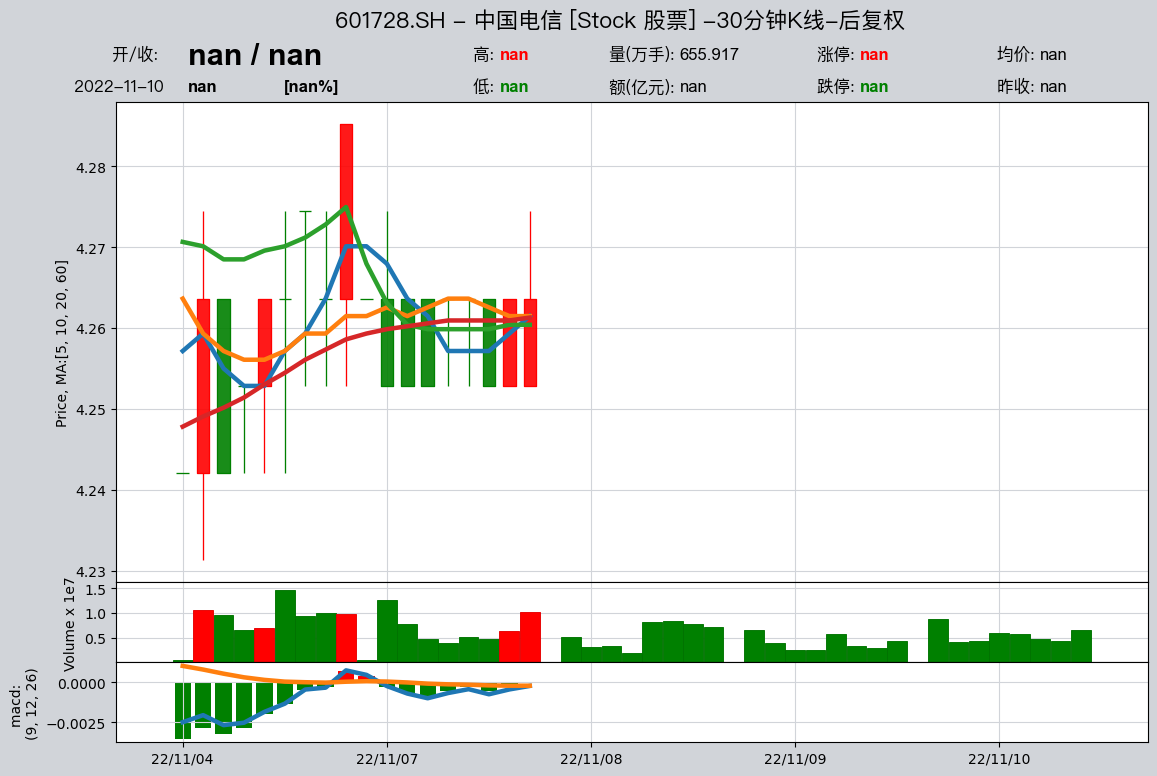
>>> df = qt.candle('601728', freq='30min', adj='b', plot_type='c')
>>> df = qt.candle('沪镍主力', start = '20211130', mav=[5, 12, 36])
>>> df = qt.candle('510300', start='20200101', asset_type='FD', adj='b', mav=[])
>>> df = qt.candle('格力电器', start='20220101', asset_type='E', adj='f', mav=[5, 10, 20, 30])
>>> df = qt.candle('513100', asset_type='FD', adj='f', mav=[])
>>> df = qt.candle('110025', asset_type='FD', adj='f', mav=[9, 28])
>>> df = qt.candle('001104', asset_type='FD', adj='f', mav=[12, 26])
2.3. 从 DataFrame 到 HistoryPanel(桥接 2.5)
上文 get_history_data() 默认返回按标的分组的 DataFrame 字典;做多标的因子研究时,更推荐直接拿到三维 HistoryPanel(标的 × 时间 × 指标):
import qteasy as qt

# 方式一:get_kline 一行取 OHLCV 面板(推荐入门)
hp = qt.get_kline(
    shares='000300.SH',
    start='20230101',
    end='20231231',
    freq='d',
    as_panel=True,
)
print(hp.shape, hp.shares, hp.htypes)
hp.plot(interactive=False)

# 方式二:get_history_data 显式指定 as_data_frame=False
hp2 = qt.get_history_data(
    htype_names='open, high, low, close, vol',
    shares='000300.SH',
    start='20230101',
    end='20231231',
    as_data_frame=False,
)
更系统的「玩数据」与因子分析见 教程 2.5 §0;可运行示例见 examples/historypanel_basic_plot.py 与 examples/data_playground_e2e.py。
2.4. Looking up the data type DataType
As mentioned earlier, all data types in qteasy are encapsulated as DataType objects, representing a kind of historical data that can be used directly. Each DataType has a unique ID. With this ID, you can extract data, reference that data type in trading strategies, and accomplish the tasks required in qteasy.
To better understand the data types in qteasy, we can use the qt.find_history_data() function to query the data types we need. The data types defined in qteasy are tied to data frequency and asset type. In other words, the closing price of different assets is a different data type, and the closing price at different frequencies is also a different data type.
The qt.find_history_data() function can search for relevant data types based on your input and display their IDs, data tables, descriptions, and other related information. For example, searching for ‘close’ (closing price) can find all related data types:
>>> qt.find_history_data('close')
You will get the following output:
matched following history data,
use "qt.get_history_data()" to load these historical data by its data_id:
------------------------------------------------------------------------
          freq asset           table            desc
data_id
close        d     E     stock_daily     股票日K线 - 收盘价
close        w     E    stock_weekly     股票周K线 - 收盘价
close        m     E   stock_monthly     股票月K线 - 收盘价
close     1min     E      stock_1min   股票60秒K线 - 收盘价
  ...      ...   ...           ...             ...
close        h    FD     fund_hourly    基金小时K线 - 收盘价
close        d   Any        top_list  融资融券交易明细 - 收盘价
========================================================================
For another example, searching for the price-to-earnings ratio (pe) yields:
>>> qt.find_history_data('pe')
You will get the following output:
matched following history data,
use "qt.get_history_data()" to load these historical data by its data_id:
------------------------------------------------------------------------
           freq asset             table                            desc
data_id
initial_pe    d     E         new_share                  新股上市信息 - 发行市盈率
pe            d   IDX   index_indicator                    指数技术指标 - 市盈率
pe            d     E   stock_indicator  股票技术指标 - 市盈率(总市值/净利润, 亏损的PE为空)
pe_2          d     E  stock_indicator2                  股票技术指标 - 动态市盈率
========================================================================
After finding the corresponding data, you only need to check which data table it belongs to, download that table into the local data source (refill_data_source(tables, ...)), and then you can use these data (qt.get_history_data(htype, shares, ...)).
A brief introduction to the DataType object
As shown above, data types in qteasy exist in the form of DataType objects. Each data type has a unique ID. With this ID you can extract data, reference the data type in trading strategies, and complete the work required in qteasy.
DataType represents a type of historical data that can be extracted from a data source. For example, the closing price of a stock daily candlestick (K-line) is one kind of historical data; the closing price of a stock weekly candlestick is another kind of historical data; and the closing price of a stock monthly candlestick is yet another kind of historical data. Although they are all closing prices, because their frequencies differ, they are encapsulated as different data types.
The DataType class encapsulates a unified data-retrieval API and attributes, greatly facilitating the use of historical data in qteasy. When we need a certain kind of historical data, we only need to use its ID and call get_history_data to retrieve it directly.
And if you need to use a certain kind of data in a trading strategy, you only need to register that data’s ID during the strategy definition process. Then you can use it directly in the strategy without worrying about details such as how the data is stored, how it is downloaded, how it is cleaned, and so on.
2.5. 最小数据集清单(供 2.5 使用)
若计划接着学习 教程 2.5,建议在本篇至少下载下列表与区间(与 快速上手指南 及 examples/data_playground_e2e.py 对齐):
数据表 |
用途 |
|---|---|
|
交易日历 |
|
证券检索 |
|
基准指数 |
|
示例个股池日线(见下) |
推荐一次性命令(Tushare 通道;日期可按需调整):
import qteasy as qt

qt.refill_data_source(tables='trade_calendar, stock_basic, index_basic')
qt.refill_data_source(
    tables='index_daily',
    symbols='000300.SH',
    start_date='20220101',
    end_date='20221231',
)
qt.refill_data_source(
    tables='stock_daily',
    symbols='000001.SZ, 600519.SH, 300750.SZ',
    start_date='20220101',
    end_date='20221231',
)
下载完成后,可运行 python examples/data_playground_e2e.py 验证 2.5 §0 最小闭环。
2.6. Download data to local storage on a regular basis
To keep the local data source up to date, we can use the qt.refill_data_source() function to periodically download data locally. Create a file refill_data.py and write the following code in it:
import qteasy as qt

if __name__ == '__main__':
    # 解析命令行参数,--tabls参数表示数据表类型,--start_date和--end_date表示下载数据的起始日期和结束日期
    import argparse
    parser = argparse.ArgumentParser(description='refill data source')
    parser.add_argument('--tables', type=str, default='stock_daily', help='data table type')
    parser.add_argument('--start_date', type=str, default='20230101', help='start date')
    parser.add_argument('--end_date', type=str, default='20231231', help='end date')
    parser.add_argument('--parallel', type=bool, default=True, help='parallel download')
    parser.add_argument('--merge_type', type=str, default='update', help='merge type')
    args = parser.parse_args()
    tables = args.tables
    start_date = args.start_date
    end_date = args.end_date
    parallel = args.parallel
    merge_type = args.merge_type

    if tables == 'events':
        # 下载低频data和event数据,下载周期较长以cover所有的季度月度周度数据 (每周下载或每月下载)
        tables = 'stock_weekly, stock_monthly, index_weekly, index_monthly, '
        tables += 'income, balance, cashflow, financial, forecast, express, comp, report, events'
    elif tables == 'basics':
        # 下载基础数据,下载周期较长以cover所有的季度月度周度数据 (每周下载或每月下载)
        tables = 'basics'
    elif tables == 'daily':
        # 下载日频数据,下载周期较短以减少下载负载 (每天或每周下载)
        tables = 'adj, stock_daily, fund_daily, future_daily, options_daily, stock_indicator, stock_indicator2, index_indicator, shibor, libor, hibor, index_daily'
    elif tables == 'stock_mins':
        tables = 'adj, stock_1min, stock_5min, stock_15min, stock_30min, stock_hourly'
    elif tables == 'index_mins':
        tables = 'adj, index_1min, index_5min, index_15min, index_30min, index_hourly'
    elif tables == 'fund_mins':
        tables = 'adj, fund_1min, fund_5min, fund_15min, fund_30min, fund_hourly'
    else:
        tables = tables

    qt.refill_data_source(tables=tables,
                          start_date=start_date,
                          end_date=end_date,
                          parallel= parallel,
                          merge_type=merge_type)
The script file above provides the most basic data download functionality. You can modify the tables and start_date/end_date parameters, as well as the parallel and merge_type parameters, as needed to download different data types and different date ranges. You can also improve the script file yourself to implement more features.
To download the full-year 2023 stock_daily data, you only need to run the following command in the command line:
(bash): python -m refill_data --tables stock_daily --start_date 20230101 --end_date 20231231
2.7. Review and summary
至此,我们已经初步了解了qteasy中对数据的管理方式,了解了数据下载的方法,学会了提取数据、显示 K 线图,以及通过 HistoryPanel 桥接到多标的研究。
建议下一篇(数据体验主路径):
教程 2.5:使用 HistoryPanel 操作和分析历史数据 — 从 §0 三十分钟闭环 开始,完成「玩数据 → 简单因子」
若已熟悉数据研究、希望直接进入回测:
关于qteasy的更多介绍,请参见 qteasy 文档。