Built-in Strategies
There are more than 70 built-in trading strategies in qteasy, which users can easily use directly. At the same time, qteasy provides a set of trading strategy combination mechanisms, and users can combine multiple simple trading strategies into a more complex trading strategy. The combination method of the strategy can be flexibly set. After combining multiple simple trading strategies into a complex strategy, the strategy optimization tool can also be used to search for the best parameters of the entire complex strategy.
In this tutorial, you will learn how to use built-in trading strategies, how to combine strategies, how to set combination rules to achieve complex strategies, and how to optimize strategies.
Built-in Strategies
qt.get_built_in_strategy(id)
qt.built_in_list(stg_id=None)
Output of the above three methods is the same, all of them list all built-in trading strategies with a dict, where the key is the ID of the trading strategy and the value is the trading strategy object. If stg_id is given, the detailed information of the specified trading strategy is printed. For example:
# 获取内置交易策略的清单
stg_list = qt.built_ins('dma')
Following information is printed:
DMA择时策略

策略参数:
    s, int, 短均线周期
    l, int, 长均线周期
    d, int, DMA周期
信号类型:
    PS型:百分比买卖交易信号
信号规则:
    在下面情况下产生买入信号:
    1, DMA在AMA上方时,多头区间,即DMA线自下而上穿越AMA线后,输出为1
    2, DMA在AMA下方时,空头区间,即DMA线自上而下穿越AMA线后,输出为0
    3, DMA与股价发生背离时的交叉信号,可信度较高

策略属性缺省值:
默认参数:(12, 26, 9)
数据类型:close 收盘价,单数据输入
采样频率:天
窗口长度:270
参数范围:[(10, 250), (10, 250), (8, 250)]
策略不支持参考数据,不支持交易数据
The built-in trading strategy can be obtained directly by the ID in qteasy
Apart from using qt.get_built_in_strategy() to get the trading strategy, the built-in trading strategy ID can also be passed as a parameter when creating the Operator object to create the trading strategy directly.
# 获取内置交易策略的ID
strategy_ids = qt.built_ins().keys()
print(list(strategy_ids)[:10])
['crossline', 'macd', 'dma', 'trix', 'cdl', 'bband', 's-bband', 'sarext', 'ssma', 'sdema']
# 使用策略ID获取交易策略
stg = qt.get_built_in_strategy('trix')
# 显示策略的相关信息
stg.info()
Strategy_type:      RuleIterator
Strategy name:      TRIX
Description:        TRIX strategy, determine long/short position according to triple exponential weighted moving average prices
Strategy Parameter: (25, 125)

Strategy Properties     Property Value
---------------------------------------
Parameter count         2
Parameter types         ['int', 'int']
Parameter range         [(2, 50), (3, 150)]
Data frequency          d
Sample frequency        d
Window length           270
Data types              ['close']
# 通过策略ID直接生成Operator
op = qt.Operator(strategies='dma, macd')
# 通过op.get_stg或op[]获取交易策略
stg_dma = op.get_stg('dma')
stg_macd = op['macd']

# 查看两个交易策略的相关信息
stg_dma.info()
stg_macd.info()
Strategy_type:      RuleIterator
Strategy name:      DMA
Description:        Quick DMA strategy, determine long/short position according to differences of moving average prices with simple timing strategy
Strategy Parameter: (12, 26, 9)

Strategy Properties     Property Value
---------------------------------------
Parameter count         3
Parameter types         ['int', 'int', 'int']
Parameter range         [(10, 250), (10, 250), (10, 250)]
Data frequency          d
Sample frequency        d
Window length           270
Data types              ['close']

Strategy_type:      RuleIterator
Strategy name:      MACD
Description:        MACD strategy, determine long/short position according to differences of exponential weighted moving average prices
Strategy Parameter: (12, 26, 9)

Strategy Properties     Property Value
---------------------------------------
Parameter count         3
Parameter types         ['int', 'int', 'int']
Parameter range         [(10, 250), (10, 250), (10, 250)]
Data frequency          d
Sample frequency        d
Window length           270
Data types              ['close']
Following built-in trading strategies are supported by qteasy:
ID |
Name |
Description |
|---|---|---|
crossline |
|
Crossline timing strategy class, using the crossover of long and short moving averages to determine the long and short state |
macd |
|
MACD timing strategy class, using MACD moving average strategy to generate target position percentage: |
dma |
|
DMA timing strategy |
trix |
|
TRIX timing strategy, using the triple smoothed exponential moving average price of stock prices for long and short judgment: |
cdl |
|
CDL timing strategy, find the cdldoji pattern that meets the requirements in the K-line chart |
bband |
TimingBBand |
Bollinger Band trading strategy, determines long and short positions based on the relationship between stock prices and the upper and lower bands of the Bollinger Bands. Trading signals are generated when the price crosses above or below the upper and lower bands. The moving average type of the Bollinger Bands is not selectable<br |
s-bband |
SoftBBand |
Bollinger Band progressive trading strategy, determines long and short positions based on the relationship between stock prices and the upper and lower bands of the Bollinger Bands. The trading signal is not generated all at once, but is gradually increased for buying and selling. Calculate BBAND, check if the price exceeds the upper or lower band of BBAND: |
sarext |
|
SAR strategy, when the indicator is greater than 0, a buy signal is issued, and when the indicator is less than 0, a sell signal is issued. |
ssma |
|
Single moving average crossover strategy - SMA moving average (simple moving average): set the position ratio according to the relative position of the stock price and the SMA moving average |
sdema |
|
Single moving average crossover strategy - DEMA moving average (double exponential smoothing moving average): set the position ratio according to the relative position of the stock price and the DEMA moving average |
sema |
|
Single moving average crossover strategy - EMA moving average (exponential smoothing moving average): set the position ratio according to the relative position of the stock price and the EMA moving average |
sht |
|
Single moving average crossover strategy - HT (Hilbert transform instantaneous trend line): set the position ratio according to the relative position of the stock price and the HT line |
skama |
|
Single moving average crossover strategy - KAMA moving average (Kaufman adaptive moving average): set the position ratio according to the relative position of the stock price and the KAMA moving average |
smama |
|
Single moving average crossover strategy - MAMA moving average (MESA adaptive moving average): set the position ratio according to the relative position of the stock price and the MAMA moving average |
st3 |
|
Single moving average crossover strategy - T3 moving average (triple exponential smoothing moving average): set the position ratio according to the relative position of the stock price and the T3 moving average |
stema |
|
Single moving average crossover strategy - TEMA moving average (triple exponential smoothing moving average): set the position ratio according to the relative position of the stock price and the TEMA moving average |
strima |
|
Single moving average crossover strategy - TRIMA moving average (triple exponential smoothing moving average): set the position ratio according to the relative position of the stock price and the TRIMA moving average |
swma |
|
Single moving average crossover strategy - WMA moving average (weighted moving average): set the position ratio according to the relative position of the stock price and the WMA moving average |
dsma |
|
Double moving average crossover strategy - SMA moving average (simple moving average): |
ddema |
|
Double moving average crossover strategy - SMA moving average (simple moving average): |
dema |
|
Double moving average crossover strategy - SMA moving average (simple moving average): |
dkama |
|
Double moving average crossover strategy - SMA moving average (simple moving average): |
dmama |
|
Double moving average crossover strategy - SMA moving average (simple moving average): |
dt3 |
|
Double moving average crossover strategy - SMA moving average (simple moving average): |
dtema |
|
Double moving average crossover strategy - SMA moving average (simple moving average): |
dtrima |
|
Double moving average crossover strategy - SMA moving average (simple moving average): |
dwma |
|
Double moving average crossover strategy - SMA moving average (simple moving average): |
slsma |
|
Slope trading strategy - SMA moving average (simple moving average): |
sldema |
|
Slope trading strategy - DEMA moving average (double exponential smoothing moving average): |
slema |
|
Slope trading strategy - EMA moving average (exponential smoothing moving average): |
slht |
|
Slope trading strategy - HT moving average (Hilbert transform - instantaneous trend line): |
slkama |
|
Slope trading strategy - KAMA moving average (Kaufman adaptive moving average): |
slmama |
|
Slope trading strategy - MAMA moving average (MESA adaptive moving average): |
slt3 |
|
Slope trading strategy - T3 moving average (triple exponential smoothing moving average): |
sltema |
|
Slope trading strategy - TEMA moving average (triple exponential smoothing moving average): |
sltrima |
|
Slope trading strategy - TRIMA moving average (triple exponential smoothing moving average): |
slwma |
|
Slope trading strategy - WMA moving average (weighted moving average): |
adx |
|
ADX indicator (Average Directional Movement Index) stock selection strategy: |
apo |
|
APO indicator (Absolute Price Oscillator) stock selection strategy: |
aroon |
|
AROON indicator stock selection strategy: |
aroonosc |
|
AROON Oscillator stock selection strategy: |
cci |
|
CCI (Commodity Channel Index) stock selection strategy: |
cmo |
|
CMO (Chande Momentum Oscillator) stock selection strategy: |
macdext |
|
MACDEXT (Extendec MACD) stock selection strategy: |
mfi |
|
MFI (Money Flow Index) stock selection strategy: |
di |
|
DI (Directory Indicator) trading strategy: |
dm |
|
DM (Directional Movement) trading strategy: |
mom |
|
MOM (momentum indicator) trading strategy: |
ppo |
|
PO (Percentage Price Oscillator) trading strategy: |
rsi |
|
RSI (Relative Strength Index) trading strategy: |
stoch |
|
STOCH (Stochastic Indicator) trading strategy: |
stochf |
|
STOCHF (Stochastic Fast Indicator) trading strategy: |
stochrsi |
|
STOCHRSI (Stochastic Relative Strength Index) trading strategy: |
ultosc |
|
ULTOSC (Ultimate Oscillator Indicator) trading strategy: |
willr |
|
WILLR (William’s %R) trading strategy: |
signal_none |
|
Empty trading signal strategy: A strategy that does not generate any trading signals |
sellrate |
|
Rate of change sell signal strategy: When the rate of change of the price exceeds the threshold, a sell signal is generated |
buyrate |
|
Rate of change buy signal strategy: When the rate of change of the price exceeds the threshold, a buy signal is generated |
long |
|
Simple timing strategy, fixed long position in the entire historical period |
short |
|
Simple timing strategy, fixed short position in the entire historical period |
zero |
|
Simple timing strategy, fixed empty position in the entire historical period |
all |
|
Select all stocks in the historical stock pool, and the investment ratio is evenly distributed |
select_none |
|
Select none of the stocks in the historical stock pool, and the investment position is 0 |
random |
|
Select a number of stocks randomly in each historical segment according to the specified proportion (when p<1), or randomly select a specified number (when p>=1) of stocks to enter the investment portfolio, and the investment ratio is evenly distributed |
finance |
|
Select stocks based on the average value of financial indicators over a period of time, basic stock selection strategy: use the average value of historical indicators of stocks as stock selection factors. The factor sorting parameter can be passed in as a strategy parameter to change the data type of the strategy. Select stocks based on different historical data. The stock selection parameters can be passed in through pars. |
ndaylast |
|
Select stocks based on the price or data indicator of the stock N days ago as the stock selection factor |
ndayavg |
|
Select stocks based on the average value of the price or data indicator of the stock over the past N days as the stock selection factor |
ndayrate |
|
Select stocks based on the percentage change of the price or data indicator of the stock over the past N days as the stock selection factor |
ndaychg |
|
Select stocks based on the change value of the price or data indicator of the stock over the past N days as the stock selection factor |
ndayvol |
|
Select stocks based on the stock price volatility over the past N days as the stock selection factor |
If you need to see a detailed explanation of each built-in trading strategy, such as the meaning of strategy parameters and signal generation rules, you can check the Doc-string of each trading strategy:
For example:
qt.built_ins('Crossline')
You can see
Init signature: qt.built_in.TimingCrossline(pars:tuple=(35, 120, 0.02))
Docstring:
crossline择时策略类,利用长短均线的交叉确定多空状态

策略参数:
    s: int, 短均线计算日期;
    l: int, 长均线计算日期;
    m: float, 均线边界宽度(百分比);
信号类型:
    PT型:目标仓位百分比
信号规则:
    1,当短均线位于长均线上方,且距离大于l*m%时,设置仓位目标为1
    2,当短均线位于长均线下方,且距离大于l*mM时,设置仓位目标为-1
    3,当长短均线之间的距离不大于l*m%时,设置仓位目标为0

策略属性缺省值:
默认参数:(35, 120, 0.02)
数据类型:close 收盘价,单数据输入
采样频率:天
窗口长度:270
参数范围:[(10, 250), (10, 250), (0, 1)]
策略不支持参考数据,不支持交易数据
File:           ~/Library/CloudStorage/OneDrive-Personal/Projects/PycharmProjects/qteasy/qteasy/built_in.py
Type:           type
Subclasses:
Detailed information about built-in trading strategies can also be displayed in interactive Python environments such as ipython using ‘?’, for example:
>>> qt.built_in.SelectingNDayRateChange?
You can see:
Init signature: qt.built_in.SelectingNDayRateChange(pars=(14,))
Docstring:
基础选股策略:根据股票以前n天的股价变动比例作为选股因子

策略参数:
    n: int, 股票历史数据的选择期
信号类型:
    PT型:百分比持仓比例信号
信号规则:
    在每个选股周期使用以前n天的股价变动比例作为选股因子进行选股
    通过以下策略属性控制选股方法:
    *max_sel_count:     float,  选股限额,表示最多选出的股票的数量,默认值:0.5,表示选中50%的股票
    *condition:         str ,   确定股票的筛选条件,默认值'any'
                                'any'        :默认值,选择所有可用股票
                                'greater'    :筛选出因子大于ubound的股票
                                'less'       :筛选出因子小于lbound的股票
                                'between'    :筛选出因子介于lbound与ubound之间的股票
                                'not_between':筛选出因子不在lbound与ubound之间的股票
    *lbound:            float,  执行条件筛选时的指标下界, 默认值np.-inf
    *ubound:            float,  执行条件筛选时的指标上界, 默认值np.inf
    *sort_ascending:    bool,   排序方法,默认值: False,
                                True: 优先选择因子最小的股票,
                                False, 优先选择因子最大的股票
    *weighting:         str ,   确定如何分配选中股票的权重
                                默认值: 'even'
                                'even'       :所有被选中的股票都获得同样的权重
                                'linear'     :权重根据因子排序线性分配
                                'distance'   :股票的权重与他们的指标与最低之间的差值(距离)成比例
                                'proportion' :权重与股票的因子分值成正比

策略属性缺省值:
默认参数:(14,)
数据类型:close 收盘价,单数据输入
采样频率:月
窗口长度:150
参数范围:[(2, 150)]
策略不支持参考数据,不支持交易数据
File:           ~/Library/CloudStorage/OneDrive-Personal/Projects/PycharmProjects/qteasy/qteasy/built_in.py
Type:           type
Subclasses:
Multiple strategies and strategy combinations
In qteasy, an Operator trader object can run multiple trading strategies simultaneously. These trading strategies will extract their respective historical data independently during operation, generating different trading signals. These trading signals will be combined into a set of trading signals for unified execution.
With this feature, users can run multiple trading strategies with different focuses in one trader object. For example, one trading strategy monitors the stock price and generates selection signals based on the stock price, while the second trading strategy is responsible for monitoring the overall market trend and determining the overall position based on it. The third trading strategy is responsible for profit-taking and stop-loss, executing stop-loss at specific times. The final trading signal is mainly based on the first trading strategy but is restrained by the second strategy and can be completely controlled by the third strategy when necessary.
Or, users can easily formulate a ‘committee’ strategy, where multiple strategies independently make trading decisions in a comprehensive strategy. The final trading signal is determined by the ‘committee’ composed of all sub-strategies through voting, which can be done by simple majority, absolute majority, weighted voting results, etc.
In above mentioned strategy combination, each independent trading strategy is simple and easy to define, while their combination can play a greater role. At the same time, each sub-strategy is independent, allowing for free combination into complex comprehensive trading strategies. This can avoid the need to repeatedly develop strategies; instead, simply rearranging and redefining the combination of sub-strategies can quickly build a series of complex comprehensive trading strategies. This is believed to greatly improve the efficiency of building trading strategies and shorten the cycle. Time is money.
However, in an Operator object, the trading signals generated by different strategies may operate at different trading prices. For example, some strategies generate opening price trading signals, while others generate closing price trading strategies. Therefore, different trading price signals should not be mixed. But apart from that, as long as the trading prices are the same, all signals should be mixed together.
Blending trading signals means various operations or functions on trading signals, ranging from simple logical operations and addition/subtraction to complex custom functions. As long as the function can be applied to an ndarray, it can theoretically be used to blend trading signals, as long as the final output trading signal is meaningful.
Defining strategy combination method blender
qteasy’s combination strategy is implemented by blender. In an Operator, if the number of strategies exceeds 1, a blender must be defined. If no blender is explicitly defined and the number of strategies exceeds 1, qteasy will create a default blender when running the Operator. However, to ensure the correct operation of multiple strategies, users need to define the blender themselves.
blender expression is a user-defined combination expression that determines the combination method of different trading strategies. This combination expression uses arithmetic operators, logical operators, functions, and other symbols to specify how strategy signals are combined. The blender expression can include the following elements:
blender expression supports the following functions:
Elements |
Examples |
Description |
|---|---|---|
Strategy Number |
|
A string starting with ‘s’ and ending with a number, where the number is the index of the strategy in the |
Numbers |
|
Any valid number, a number that participates in expression operations |
Operators |
|
arithmetic operators like |
Logical Operators |
|
Supports `& |
Functions |
|
Functions supported are listed in the table below |
Perentheses |
|
Combined Operations |
Examples of blender
When there are three trading strategies in an Operator object (with indices 0/1/2), the following ways of defining blender are all valid and can be used. At the same time, use Operator.set_blender() to set blender:
Defining blender expression using arithmetic operators
's0 + s1 + s2'
The trading signals generated by the three trading strategies will be added together to form the final trading signal. If the result of strategy 0 is a buy of 10%, the result of strategy 1 is a buy of 10%, and the result of strategy 2 is a buy of 30%, then the final result is a buy of 50%.
Defining blender expression using logical operators:
's0 and s1 and s2'
Indicating that a trading signal will only be formed when trading strategies 1, 2, and 3 all have trading signals. For example, if the result of strategy 1 is a buy, the result of strategy 2 is a buy, and strategy 3 has no trading signal, then the final result is no trading signal.
Functions and parentheses can also be included in the blender expression:
'max(s0, s1) + s2'
The maximum value of the results of strategies 1 and 2 is added to the result of strategy 3 to form the final trading signal. If the result of strategy 1 is a buy of 10%, the result of strategy 2 is a buy of 20%, and the result of strategy 3 is a buy of 30%, then the final result is a buy of 50%.
Same strategy can appear more than once in the blender expression, and pure numbers can also appear:
'(0.5 * s0 + 1.0 * s1 + 1.5 * s2) / 3 * min(s0, s1, s2)'
Above blender expression indicates: First, calculate the weighted average of the three strategy signals (with weights of 0.5, 1.0, and 1.5), and then multiply by the minimum value of the three signals.
Function parameters in the blender expression are defined in the function name:
'clip_-0.5_0.5(s0 + s1 + s2) + pos_2_0.2(s0, s1, s2)'
Above blender expression defines two different function operations, and the results are added together to obtain the final result. The first function is a range clipping function, which adds the three sets of strategy signals and clips the signal values less than -0.5 and greater than 0.5 to obtain the calculation result. The second function is a position judgment function, which counts the time periods when the three sets of signals have positions greater than 0.2, defining them as ‘long’. Then, it counts the number of strategies suggesting long positions in each time period. If more than two strategies suggest long positions, it outputs a full long position; otherwise, it outputs an empty position.
blender expression supports the following functions:
Functions |
Expressions |
Description |
|---|---|---|
abs |
|
absolute value function |
avg |
|
Average value function |
avgpos |
|
Average cumulative function |
ceil |
|
Ceiling function |
clip |
|
Clipping function |
combo |
|
Combo function |
committee |
|
Committee function (equivalent to cumulative position function) |
exp |
|
Exponent function |
floor |
|
Floor function |
log |
|
Logarithm function |
log10 |
|
Logarithm base 10 function |
max |
|
Maximum value function |
min |
|
Minimum value function |
pos |
|
Cumulative position function |
position |
|
Cumulative position function |
pow |
|
Power function |
power |
|
Power function |
sqrt |
|
Square root function |
str |
|
Cumulative strength function |
strength |
|
Cumulative strength function |
sum |
|
Combo function |
unify |
|
Unifying function |
vote |
|
Voting function (equivalent to cumulative position function) |
blender can be set or retrieved using the following methods
operator.set_blender(blender=None, price_type=None)
Pass in an expression directly to set the blender, which will be automatically parsed and used to combine trading strategies.
operator.view_blender()
View blender
Examples of blender usage
Here is an example to demonstrate how blender works:
# 创建一个交易员对象,同时运行五个相同的dma交易策略,这些交易策略运行方式相同,但是设置不同的参数后,会产生不同的交易信号。我们通过不同的策略组合方式,得到不同的回测结果
op = qt.Operator('dma, dma, dma, dma, dma')
# 分别给五个不同的交易策略设置不同的策略参数,使他们产生不同的交易信号
op.set_parameter(stg_id=0, pars=(132, 200, 24))
op.set_parameter(stg_id=1, pars=(124, 187, 51))
op.set_parameter(stg_id=2, pars=(103, 81, 16))
op.set_parameter(stg_id=3, pars=(48, 111, 148))
op.set_parameter(stg_id=4, pars=(104, 127, 58))
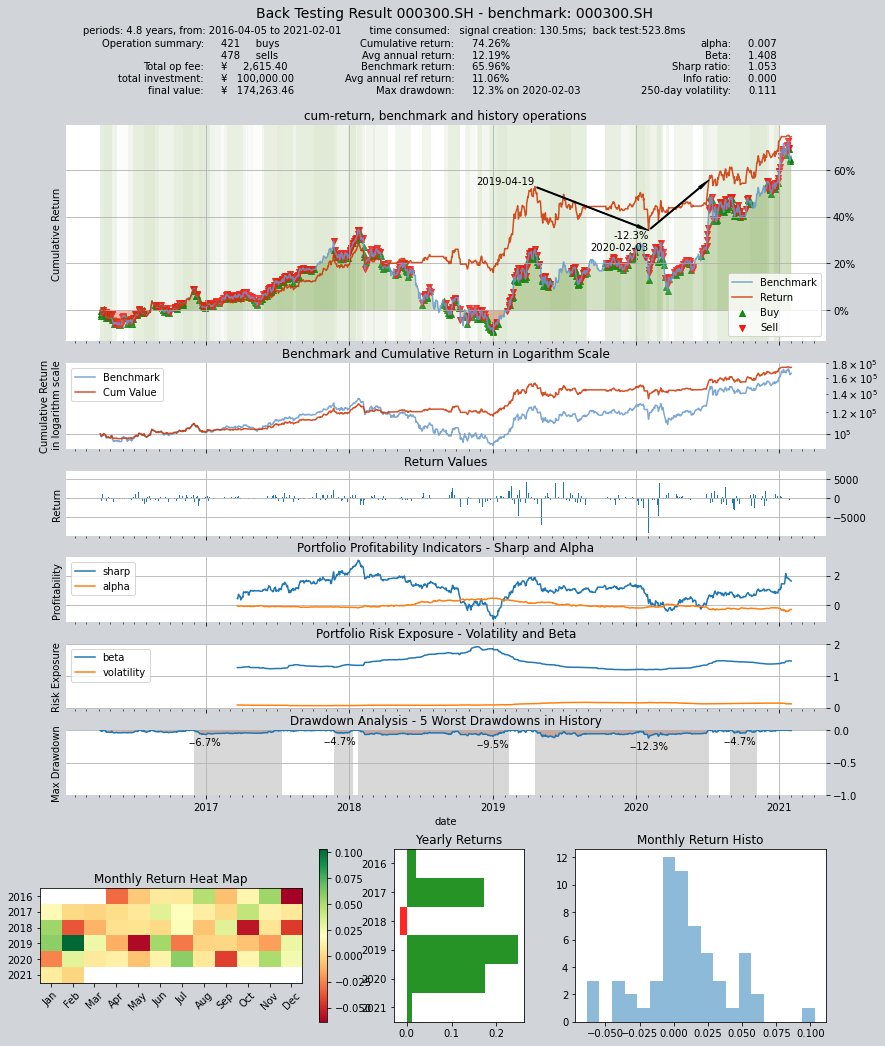
# 第一种组合方式:加权平均方式:分别给每一个不同的策略设置不同的权重:
# s0: 权重0.8
# s0: 权重1.2
# s0: 权重2.0
# s0: 权重0.5
# s0: 权重1.5
# 将五个交易策略生成的交易信号加权平均后得到最终的交易信号
op.set_blender('(0.8*s0+1.2*s1+2*s2+0.5*s3+1.5*s4)/5')
# 运行策略
res = qt.run(op, mode=1)
# 得到结果如下:年化收益12.19,夏普率1.053
     ====================================
     |                                  |
     |       BACK TESTING RESULT        |
     |                                  |
     ====================================

qteasy running mode: 1 - History back testing
time consumption for operate signal creation: 130.5ms
time consumption for operation back looping:  523.8ms

investment starts on      2016-04-05 00:00:00
ends on                   2021-02-01 00:00:00
Total looped periods:     4.8 years.

-------------operation summary:------------

          Sell Cnt Buy Cnt Total Long pct Short pct Empty pct
000300.SH   478      421    899   89.7%      0.0%     10.3%

Total operation fee:     ¥    2,615.40
total investment amount: ¥  100,000.00
final value:              ¥  174,263.46
Total return:                    74.26%
Avg Yearly return:               12.19%
Skewness:                         -0.31
Kurtosis:                         10.31
Benchmark return:                65.96%
Benchmark Yearly return:         11.06%

------strategy loop_results indicators------
alpha:                            0.007
Beta:                             1.408
Sharp ratio:                      1.053
Info ratio:                       0.000
250 day volatility:               0.111
Max drawdown:                    12.26%
    peak / valley:        2019-04-19 / 2020-02-03
    recovered on:         2020-07-06
===========END OF REPORT=============
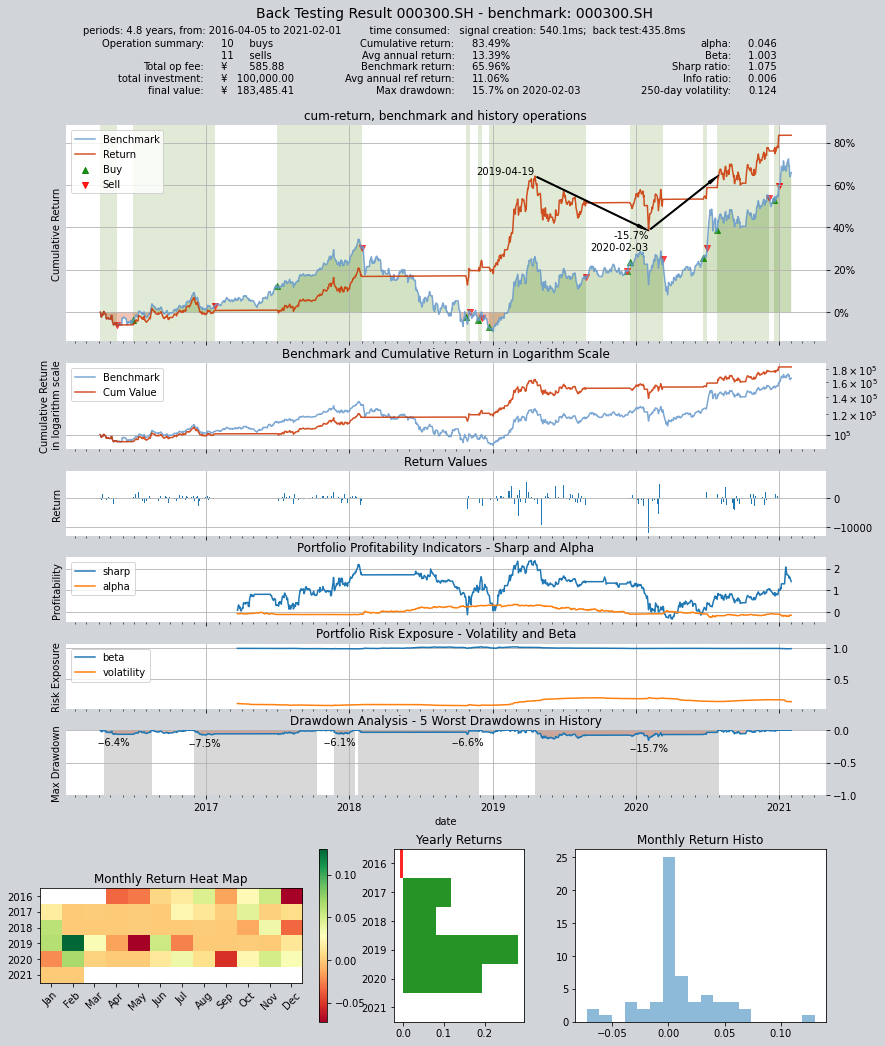
# 第二种组合方式:将五个交易策略看成一个“委员会”,最终的持仓仓位由委员会投票决定:
# 当同一时间累计五个策略中至少三个输出多头满仓使,输出多头满仓,否则空仓
op.set_blender('pos_3_0(s0, s1, s2, s3, s4)')
# 运行策略
res = qt.run(op, mode=1)
# 得到结果如下:年化收益13.39,夏普率1.075
     ====================================
     |                                  |
     |       BACK TESTING RESULT        |
     |                                  |
     ====================================

qteasy running mode: 1 - History back testing
time consumption for operate signal creation: 540.1ms
time consumption for operation back looping:  435.8ms

investment starts on      2016-04-05 00:00:00
ends on                   2021-02-01 00:00:00
Total looped periods:     4.8 years.

-------------operation summary:------------

          Sell Cnt Buy Cnt Total Long pct Short pct Empty pct
000300.SH    11       10     21   55.4%      0.0%     44.6%

Total operation fee:     ¥      585.88
total investment amount: ¥  100,000.00
final value:              ¥  183,485.41
Total return:                    83.49%
Avg Yearly return:               13.39%
Skewness:                         -0.43
Kurtosis:                         14.75
Benchmark return:                65.96%
Benchmark Yearly return:         11.06%

------strategy loop_results indicators------
alpha:                            0.046
Beta:                             1.003
Sharp ratio:                      1.075
Info ratio:                       0.006
250 day volatility:               0.124
Max drawdown:                    15.71%
    peak / valley:        2019-04-19 / 2020-02-03
    recovered on:         2020-07-31
===========END OF REPORT=============
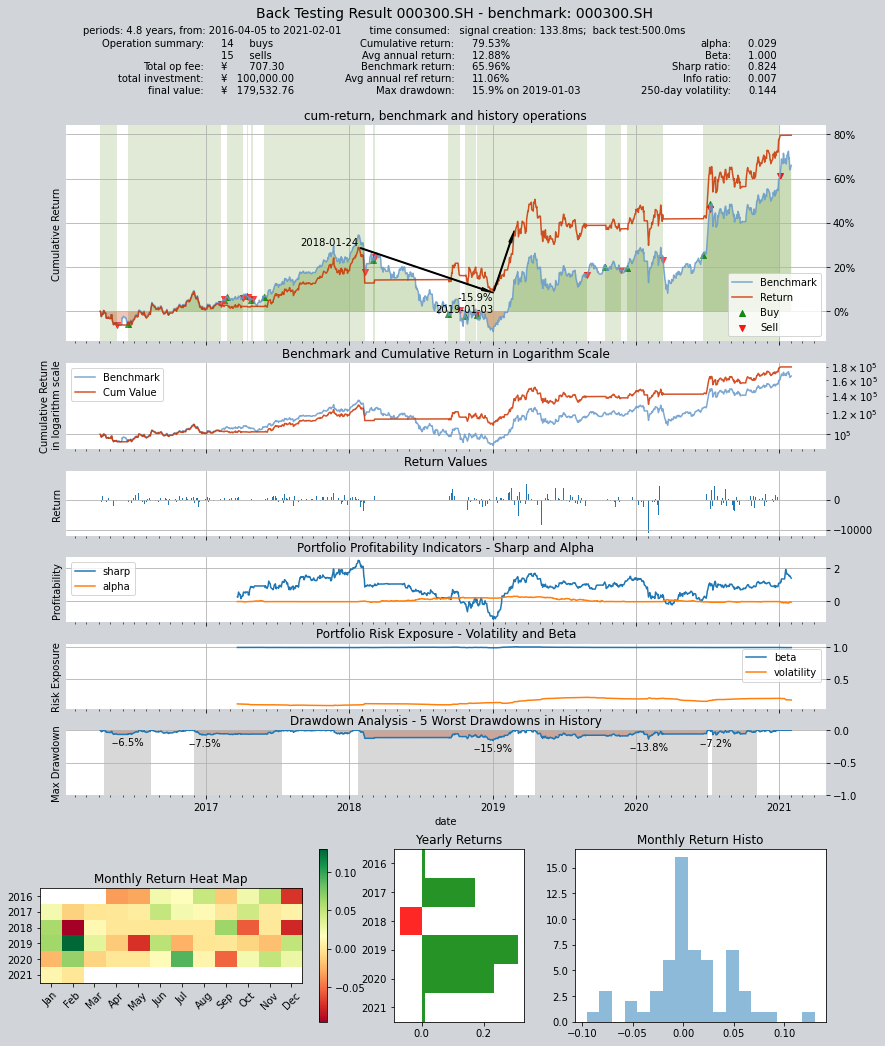
# 第三种组合方式:同样是委员会策略,但输出满仓多头的投票门槛变为2票,即只要有两个策略认为输出多头即可
op.set_blender('pos_2_0(s0, s1, s2, s3, s4)')
# 运行策略
res = qt.run(op, mode=1)
# 得到结果如下:年化收益12.88,夏普率0.824
     ====================================
     |                                  |
     |       BACK TESTING RESULT        |
     |                                  |
     ====================================

qteasy running mode: 1 - History back testing
time consumption for operate signal creation: 133.8ms
time consumption for operation back looping:  500.0ms

investment starts on      2016-04-05 00:00:00
ends on                   2021-02-01 00:00:00
Total looped periods:     4.8 years.

-------------operation summary:------------

          Sell Cnt Buy Cnt Total Long pct Short pct Empty pct
000300.SH    15       14     29   71.4%      0.0%     28.6%

Total operation fee:     ¥      707.30
total investment amount: ¥  100,000.00
final value:              ¥  179,532.76
Total return:                    79.53%
Avg Yearly return:               12.88%
Skewness:                         -0.45
Kurtosis:                         10.45
Benchmark return:                65.96%
Benchmark Yearly return:         11.06%

------strategy loop_results indicators------
alpha:                            0.029
Beta:                             1.000
Sharp ratio:                      0.824
Info ratio:                       0.007
250 day volatility:               0.144
Max drawdown:                    15.94%
    peak / valley:        2018-01-24 / 2019-01-03
    recovered on:         2019-02-25
===========END OF REPORT=============