6. Enhanced Index Stock Selection
Reference source: docs/_joinquant_migration_source/Example_06_index-enhanced stock selection.ipynb First Markdown cell.
This strategy tracks the index constituents of the Shanghai and Shenzhen 300 with an initial weight of 0.8. The percentage of individual stocks is (0.8 * constituent stock weight) * 100%. Then, according to whether the individual stocks: 1. rose for 5 consecutive days 2. fell for 5 consecutive days, to determine whether the individual stocks are strong stocks/weak stocks, and adjust their weights from 0.8 to 1.0 or 0.6.
Frequency of strategy run: daily operation Time of strategy operation: before the close of each day
Backtest time: 2021-01-01 to 2022-12-31
6.1. 1. 策略代码
Create a custom trading strategy:
import qteasy as qt
import numpy as np
from qteasy import Parameter, StgData


class IndexEnhancement(qt.GeneralStg):

    def __init__(self):
        super().__init__(
                pars=[
                    Parameter((0.01, 0.99), name='weight_threshold', par_type='float', value=0.35),
                    Parameter((0.51, 0.99), name='init_weight', par_type='float', value=0.8),
                    Parameter((2, 20), name='price_days', par_type='int', value=5),
                ],
                name='IndexEnhancement',
                description='跟踪HS300指数选股,并根据连续上涨/下跌趋势判断强弱势以增强权重',
                data_types=[
                    StgData('wt_idx|000300.SH', freq='m', asset_type='E', window_length=2),
                    StgData('close', freq='d', asset_type='E', window_length=40),
                ],
        )

    def realize(self):
        weight_threshold, init_weight, price_days = self.get_pars('weight_threshold', 'init_weight', 'price_days')
        # 读取投资组合的权重wt和最近price_days天的收盘价
        wt = self.get_data('wt_idx|000300.SH_E_m')[-1]
        close_windows = self.get_data('close_E_d')
        pre_close = close_windows[-price_days - 1:-1]
        close = close_windows[-price_days:]  # 当前所有股票的最新连续收盘价

        # 计算连续price_days天的收益
        stock_returns = close - pre_close

        # 设置初始选股权重为0.8
        weights = init_weight * np.ones_like(wt)

        # 剔除掉权重小于weight_threshold的股票
        weights[wt < weight_threshold] = 0

        # 找出强势股,将其权重设为1, 找出弱势股,将其权重设置为 init_weight - (1 - init_weight)
        up_trends = np.all(stock_returns > 0, axis=1)
        weights[up_trends] = 1.0
        down_trend_weight = init_weight - (1 - init_weight)
        down_trends = np.all(stock_returns < 0, axis=1)
        weights[down_trends] = down_trend_weight

        # 实际选股权重为weights * HS300权重
        weights *= wt

        return weights
6.2. 2. 策略回测
Backtest parameters:
Backtest time: 2021-01-01 to 2022-12-31
Asset type: stocks
Asset pool: Shanghai and Shenzhen 300 constituents
Initial investment: 1 million
Purchase batch: 100 shares
Sell batch: 1 share
shares = qt.filter_stock_codes(index='000300.SH', date='20210101')
print(len(shares), shares[:10])
alpha = IndexEnhancement()
op = qt.Operator(alpha, signal_type='PT')
op.op_type = 'stepwise'
op.set_blender('1.0*s0')
res = qt.run(op, mode=1,
       invest_start='20210101',
       invest_end='20221231',
       invest_cash_amounts=[1000000],
       asset_type='E',
       asset_pool=shares,
       trade_batch_size=100,
       sell_batch_size=1,
       trade_log=True,
      )

print()
6.3. Backtest results
419 ['000001.SZ', '000002.SZ', '000063.SZ', '000066.SZ', '000069.SZ', '000100.SZ', '000157.SZ', '000166.SZ', '000333.SZ', '000338.SZ']
No match found! To get better result, you can
- pass "match_full_name=True" to match full names of stocks and funds
====================================
| |
| BACK TESTING RESULT |
| |
====================================
qteasy running mode: 1 - History back testing
time consumption for operate signal creation: 0.0 ms
time consumption for operation back looping: 13 sec 461.8 ms
investment starts on 2021-01-04 00:00:00
ends on 2022-12-30 00:00:00
Total looped periods: 2.0 years.
-------------operation summary:------------
Only non-empty shares are displayed, call
"loop_result["oper_count"]" for complete operation summary
Sell Cnt Buy Cnt Total Long pct Short pct Empty pct
000001.SZ 0 3 3 100.0% 0.0% 0.0%
000002.SZ 0 2 2 100.0% 0.0% 0.0%
000063.SZ 0 0 0 100.0% 0.0% 0.0%
000100.SZ 1 5 6 66.9% 0.0% 33.1%
000333.SZ 0 1 1 100.0% 0.0% 0.0%
000338.SZ 1 1 2 62.3% 0.0% 37.7%
000651.SZ 0 1 1 100.0% 0.0% 0.0%
000725.SZ 0 95 95 100.0% 0.0% 0.0%
000858.SZ 0 0 0 100.0% 0.0% 0.0%
002027.SZ 1 3 4 62.3% 0.0% 37.7%
... ... ... ... ... ... ...
601229.SH 1 3 4 50.2% 0.0% 49.8%
601288.SH 0 76 76 100.0% 0.0% 0.0%
601318.SH 0 3 3 100.0% 0.0% 0.0%
601328.SH 0 30 30 100.0% 0.0% 0.0%
601398.SH 0 106 106 100.0% 0.0% 0.0%
601601.SH 1 0 1 78.8% 0.0% 21.2%
601668.SH 0 15 15 100.0% 0.0% 0.0%
601688.SH 0 1 1 100.0% 0.0% 0.0%
601899.SH 0 4 4 100.0% 0.0% 0.0%
603259.SH 0 0 0 100.0% 0.0% 0.0%
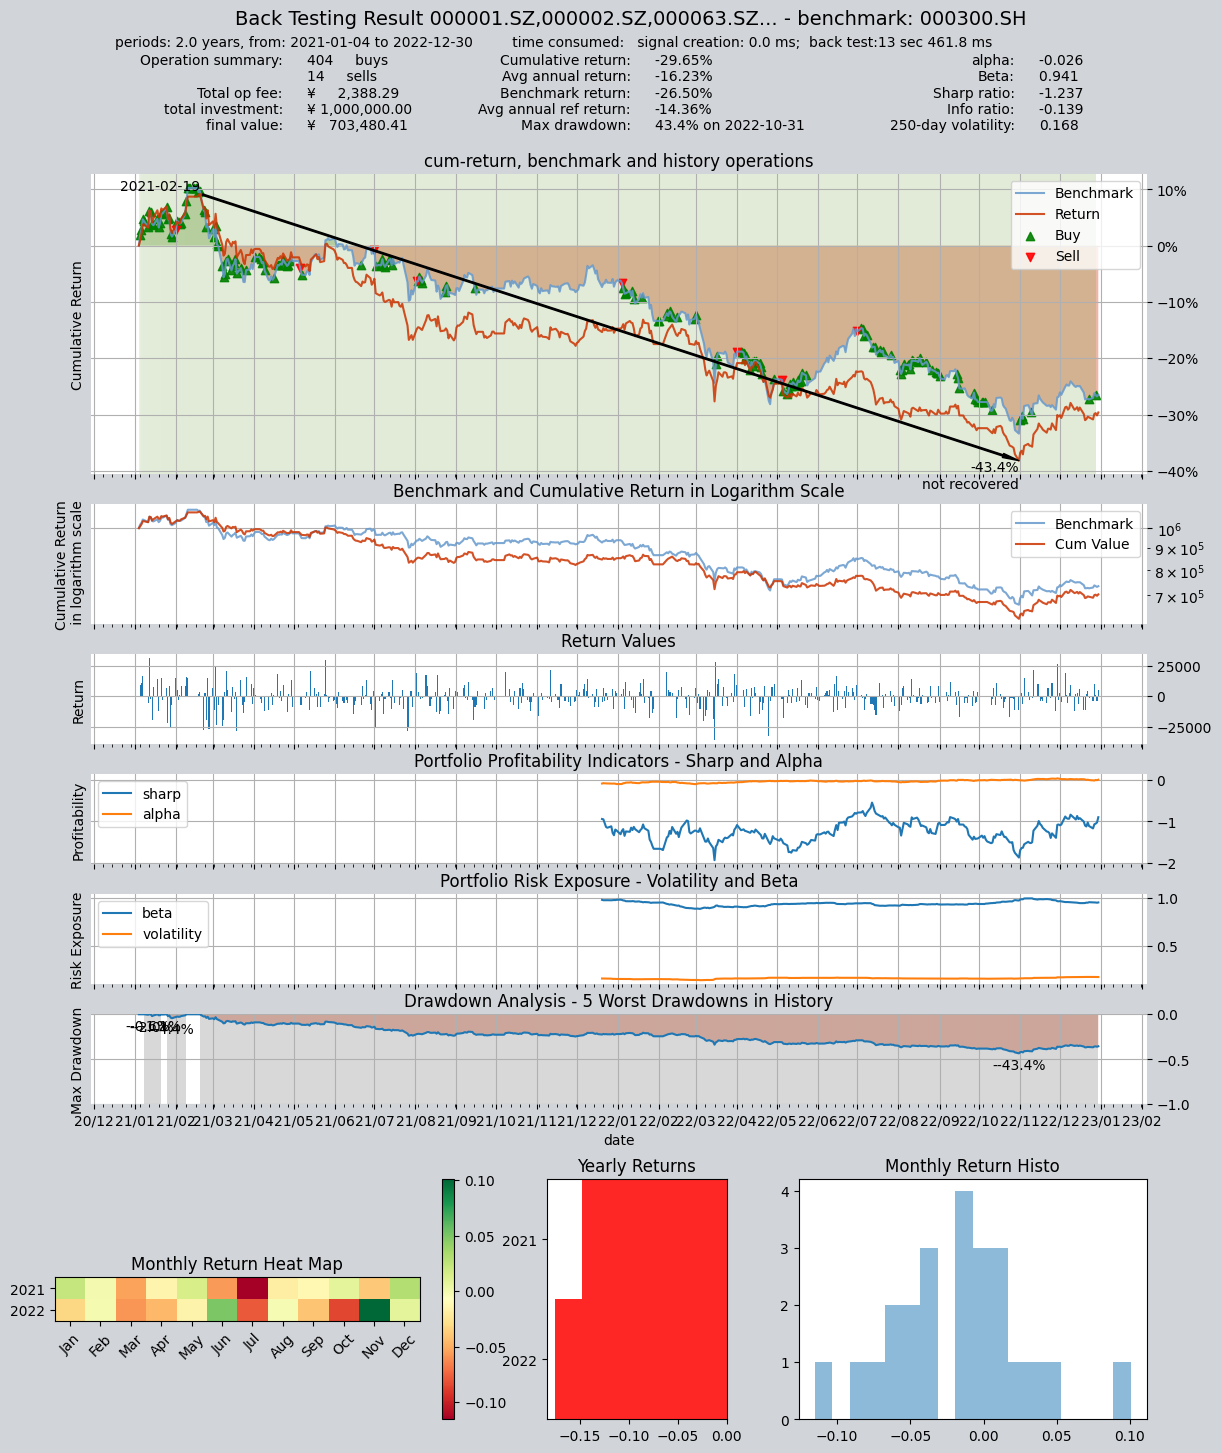
Total operation fee: ¥ 2,388.29
total investment amount: ¥1,000,000.00
final value: ¥ 703,480.41
Total return: -29.65%
Avg Yearly return: -16.23%
Skewness: -0.02
Kurtosis: 1.63
Benchmark return: -26.50%
Benchmark Yearly return: -14.36%
------strategy loop_results indicators------
alpha: -0.026
Beta: 0.941
Sharp ratio: -1.237
Info ratio: -0.139
250 day volatility: 0.168
Max drawdown: 43.41%
peak / valley: 2021-02-19 / 2022-10-31
recovered on: Not recovered!
===========END OF REPORT=============