5. Psuedo-Grid Trading Strategy
Reference source: docs/_joinquant_migration_source/Example_05_Class Grid Trading.ipynb First Markdown cell.
This strategy first calculates the mean and standard deviation of the past 300 price data points (the number of days is an adjustable parameter).
The grid interval boundaries are obtained by adding or subtracting 1 and 2 standard deviations from the mean (the multiplier for adding or subtracting standard deviations is an adjustable parameter).
They are assigned position weights of 0.3 and 0.5 respectively (position weights are adjustable parameters).
Then, configure the position size based on the price range (+/-40 is the upper and lower bound, which has no practical significance): (-40,-3],(-3,-2],(-2,2],(2,3],(3,40] (the specific price is equal to the mean plus a multiple of the standard deviation) [-0.5, -0.3, 0.0, 0.3, 0.5] (capital ratio; the negative sign here indicates opening a short position, and it is set to allow holding short positions during backtesting).
The backtesting data consists of 1-minute data points for the HS300 index. The backtesting period is from 09:30:00 on March 1, 2022 to 15:00:00 on July 31, 2022.
import qteasy as qt
print(qt.__version__)
5.1. Define trading strategy
import numpy as np
from qteasy import Parameter, StgData


class GridTrading(qt.GeneralStg):

    def __init__(self):
        super().__init__(
            name='GridTrading',
            description='根据过去窗口的均值和标准差分档生成目标仓位',
            pars=[
                Parameter((0.5, 3.0), name='low_th', par_type='float', value=2.0),
                Parameter((2.0, 8.0), name='high_th', par_type='float', value=3.0),
                Parameter((0.01, 0.6), name='low_pos', par_type='float', value=0.3),
                Parameter((0.1, 1.0), name='high_pos', par_type='float', value=0.5),
                Parameter((60, 500), name='lookback', par_type='int', value=300),
            ],
            data_types=StgData('close', freq='1min', asset_type='ANY', window_length=500),
            use_latest_data_cycle=False,
        )

    def realize(self):
        low_th, high_th, low_pos, high_pos, lookback = self.get_pars(
            'low_th', 'high_th', 'low_pos', 'high_pos', 'lookback'
        )
        close = self.get_data('close_ANY_1min')
        close = close[-lookback:]
        close_mean = np.nanmean(close, axis=0)
        close_std = np.nanstd(close, axis=0)
        current_close = close[-1]
        hi_positive = close_mean + high_th * close_std
        low_positive = close_mean + low_th * close_std
        low_negative = close_mean - low_th * close_std
        hi_negative = close_mean - high_th * close_std
        pos = np.zeros_like(close_mean, dtype=float)
        pos = np.where(current_close > hi_positive, high_pos, pos)
        pos = np.where((current_close <= hi_positive) & (current_close > low_positive), low_pos, pos)
        pos = np.where((current_close <= low_positive) & (current_close > low_negative), 0.0, pos)
        pos = np.where((current_close <= low_negative) & (current_close > hi_negative), -low_pos, pos)
        pos = np.where(current_close <= hi_negative, -high_pos, pos)
        return pos
5.2. Define the trader object, configure the trading settings, and perform trading backtesting.
alpha = GridTrading()
op = qt.Operator(alpha, signal_type='PT')
op.op_type = 'batch'
op.set_blender("1.0*s0")
res = qt.run(op,
        mode=1,
        invest_start='20220401',
        invest_end='20220731',
        invest_cash_amounts=[1000000],
        asset_type='IDX',
        asset_pool=['000300.SH'],
        trade_batch_size=0.01,
        sell_batch_size=0.01,
        trade_log=True,
        allow_sell_short=True,
)
====================================
| |
| BACK TESTING RESULT |
| |
====================================
qteasy running mode: 1 - History back testing
time consumption for operate signal creation: 3 sec 180.8 ms
time consumption for operation back looping: 14 sec 844.9 ms
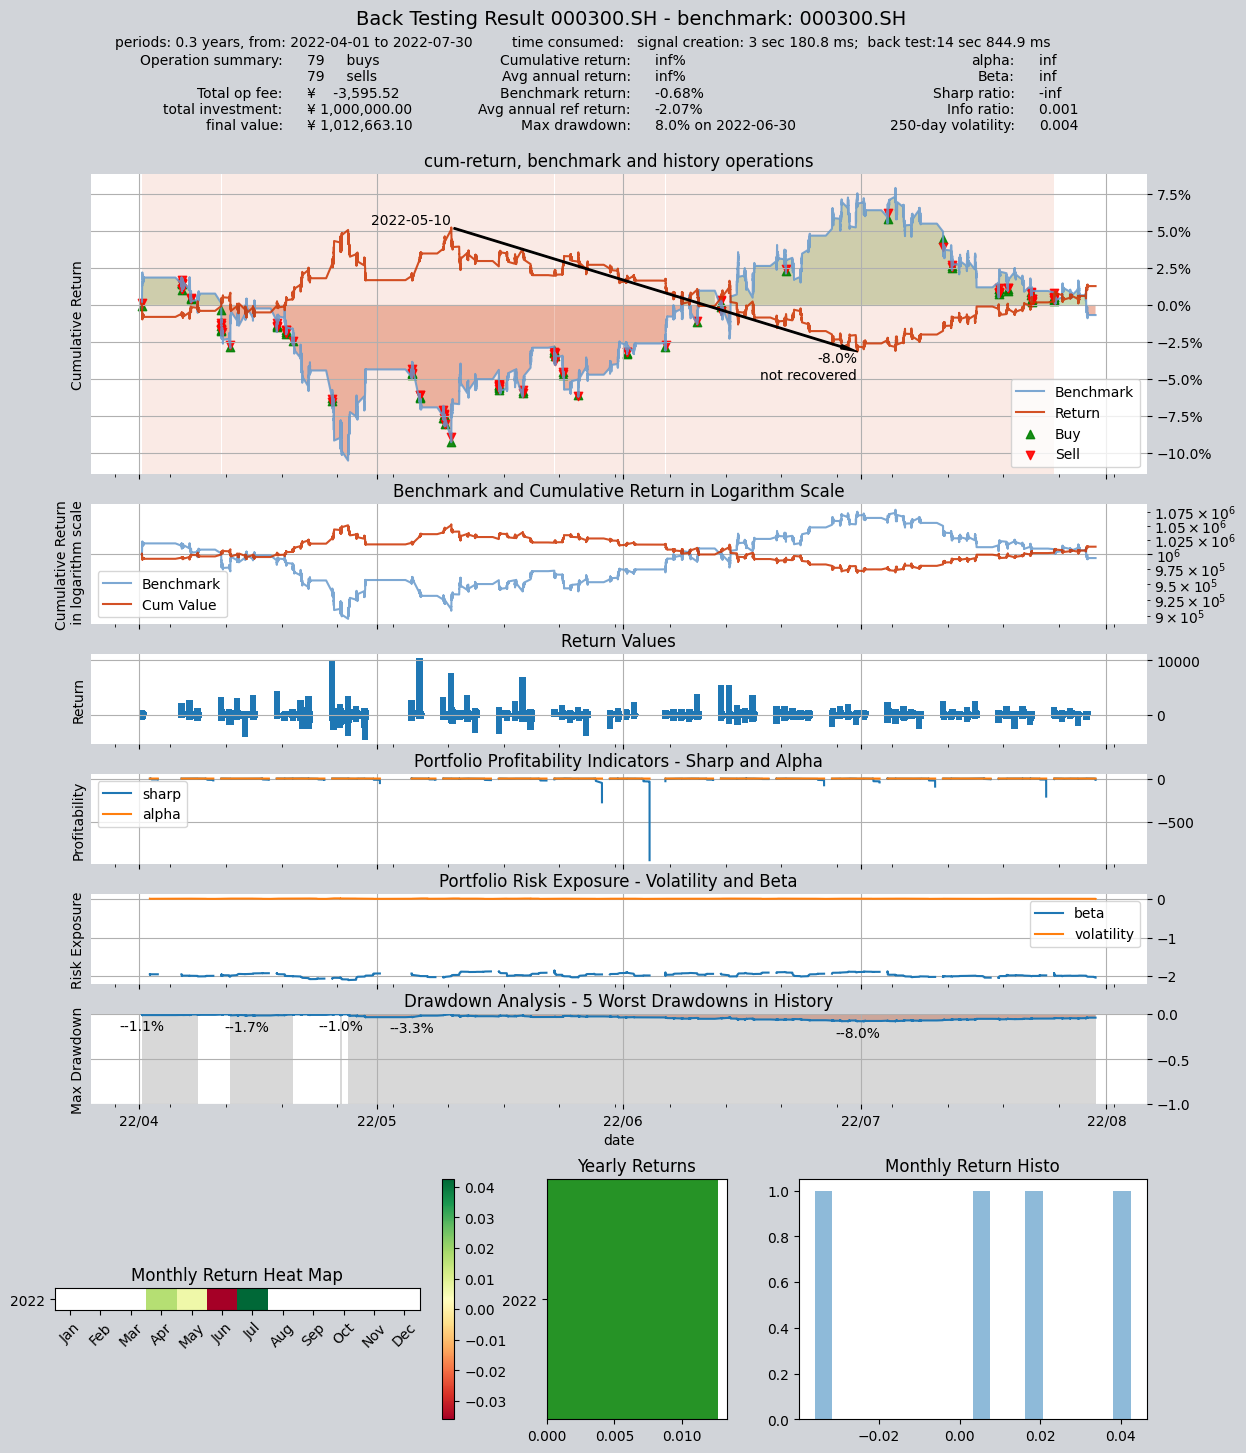
investment starts on 2022-04-01 09:30:00
ends on 2022-07-30 15:00:00
Total looped periods: 0.3 years.
-------------operation summary:------------
Only non-empty shares are displayed, call
"loop_result["oper_count"]" for complete operation summary
Sell Cnt Buy Cnt Total Long pct Short pct Empty pct
000300.SH 79 79 158 0.0% 98.1% 1.9%
Total operation fee: ¥ -3,595.52
total investment amount: ¥1,000,000.00
final value: ¥1,012,663.10
Total return: inf%
Avg Yearly return: inf%
Skewness: 3.34
Kurtosis: 116.90
Benchmark return: -0.68%
Benchmark Yearly return: -2.07%
------strategy loop_results indicators------
alpha: inf
Beta: inf
Sharp ratio: -inf
Info ratio: 0.001
250 day volatility: 0.004
Max drawdown: 7.95%
peak / valley: 2022-05-10 / 2022-06-30
recovered on: Not recovered!
===========END OF REPORT=============