Download and Manage Financial Data
This Example demonstrates how to download, manage, and extract financial data stored locally using the qteasy module. QTEASY supplies a complete set of tools to help you download and manage financial data. You can download a wide range of financial data from the tushare server, store it locally, and automatically extract it from the local storage when needed for backtesting or strategy execution.
Loacl Data Source Object DataSource
There is a DataSource object defined in qteasy, which defines a local financial data source and provides a series of built-in local financial data tables and data types. Users can directly read the corresponding financial data by using the ID of various data types (provided that these financial data have been downloaded from the Internet and saved to the local data source).
Large amounts of commonly used financial data, such as ‘close’ and ‘pe’, are predefined and built into qteasy. These data cover a wide range, including:
Volume and prices, such as opening price open, closing price close, high price high, trading volume vol, etc.
Financial indicators, such as price-earnings ratio pe, price-to-book ratio pb
Financial statements, such as ebidta, ebit, etc.
Basic company information, such as management names and company industry information
Above data is predefined and defined in the system in the form of ‘data tables’. If you need to use this data, you must first download the data to the local. The DataSource object defines the method and location of data storage. qteasy defines a default data source object QT_DATA_SOURCE, and in the absence of special instructions, all data operated and used by qteasy are in this data source.
DataSource object can save data in file format (csv, fth, etc.), or save data in a mysql database. Given the volume of financial data, it is recommended to save data in the database. The data storage method and location can be set in the configuration of qteasy.
Two types of data sources for DataSource
qt.DataSource(source_type, file_type='fth', file_loc='qteasy/data/', host='localhost', port=3306, user=None, password=None, db='qt_db')
Users may choose to store data in different forms, also known as data sources, for a DataSource object. DataSource currently supports two different data sources:
db: data is stored in a mysql/Maria DB database, accessed by establishing a database connection
file: data is stored in the specified folder in the form of a file, supporting three file formats: csv, hdf5, and feather
As the volume of financial data is large (for example, the historical data of daily K-line for all stocks has more than ten million rows of data, and the data volume of minute-level K-line is even larger), it is recommended to use the mysql database to store data. If you use local files to store data, the efficiency of data exchange will be very low.
Following parameters are used to establish a DataSource object connected to a local database:
import qteasy as qt
ds_db = qt.DataSource(source_type='db', host='localhost', port=3306, user='user', password='password', db='qt_db')
You can learn about the connection nature of the DataSource object through the connection_type attribute
print(ds_db.connection_type)
ds_db
db:mysql://localhost@3306/qt_db

DataSource('db', 'localhost', 3306)
Following parameters can be used to establish a DataSource object using the local folder
import qteasy as qt
ds_csv = qt.DataSource(source_type='file', file_loc='src/data', file_type='csv')

print(ds_csv.connection_type)
ds_csv
file://csv@qt_root/qteasy/data

DataSource('file', 'qteasy/data', 'csv')
View the current configuration variables using qt.configuration, and view the type and parameters of the current data source using qt.QT_DATA_SOURCE
qt.configuration(config_key='local_data_source, local_data_file_type, local_data_file_path', default=False)
qt.QT_DATA_SOURCE
No. Config-Key            Cur Val
-----------------------------------------
1   local_data_source     database
2   local_data_file_type  csv
3   local_data_file_path  qteasy/data/

DataSource('db', 'localhost', 3306)
Historical Data Types
qteasy can manage multiple data types, automatically download these types of data, and store them locally for trading strategies to call. Each type of data has a built-in data ID (data_id). Based on this data_id, users can view, read, and download the corresponding data.
qt.find_history_data(s, match_description=False, fuzzy=False, freq=None, asset_type=None, match_threshold=0.85,)
qt.find_history_data() can find all built-in data types in qteasy, listing the data ID, asset type, frequency, and detailed description of the data. Using qt.get_history_data() and passing the found data ID as a parameter, you can directly view the downloaded historical data.
import qteasy as qt
qt.find_history_data('pe')
Output is as follows:
matched following history data,
use "qt.get_history_data()" to load these historical data by its data_id:
------------------------------------------------------------------------
           freq asset             table                            desc
data_id
initial_pe    d     E         new_share                  新股上市信息 - 发行市盈率
pe            d   IDX   index_indicator                    指数技术指标 - 市盈率
pe            d     E   stock_indicator  股票技术指标 - 市盈率(总市值/净利润, 亏损的PE为空)
pe_2          d     E  stock_indicator2                  股票技术指标 - 动态市盈率
========================================================================
import qteasy as qt
qt.get_history_data('pe', '000001.SZ', start="20220101", end="20220201")
Out[16]:
{'000001.SZ':
                  pe
 2022-01-04  11.1761
 2022-01-05  11.5048
 2022-01-06  11.4847
 2022-01-07  11.5384
 2022-01-10  11.5317
 2022-01-11  11.6792
 2022-01-12  11.4042
 2022-01-13  11.3908
 2022-01-14  10.9547
 2022-01-17  10.8809
 2022-01-18  11.0822
 2022-01-19  11.0688
 2022-01-20  11.6256
 2022-01-21  11.6390
 2022-01-24  11.5384
 2022-01-25  11.3036
 2022-01-26  11.1694
 2022-01-27  10.9346
 2022-01-28  10.6193
 2022-01-31  10.6193
 2022-02-01  10.6193}
Check local data source data
Using qt.get_table_overview() you can view the amount of data already downloaded in the current data source. When the amount of data is large, it takes a few minutes to analyze all the data and print the amount of data in the data table, disk space occupied, and data range in the local data source.
Local data is stored in several data tables, and you can also use qt.get_table_info() to obtain detailed information about a specific data table. In addition to the primary key type and value range of the data table, it also includes the name, meaning, and data type of each data column.
qt.get_table_info(table_name, data_source=None, verbose=True)
Get information about a data table, including the amount of data (number of rows), disk space occupied, name of the primary key, and data range. If verbose=True is set, you can also view the complete information of the data columns in the data table, including column names, data types, and descriptions.
qt.get_table_overview(data_source=None)
Print an overview of the amount of data in all data tables in the data source
Acquire information about a data table using qt.get_table_info():
qt.get_table_info('stock_15min', verbose=True)
<stock_15min>, 15.85GB/100.9M records on disc
primary keys:
-----------------------------------
1:  ts_code:       *<CRITICAL>*
    <unknown> entries
    starts: 000001.SZ, end: 689009.SH
2:  trade_time:
    <unknown> entries
    starts: 20090105, end: 20220323

columns of table:
------------------------------------
      columns       dtypes remarks
0     ts_code  varchar(20)    证券代码
1  trade_time     datetime  交易日期时间
2        open        float     开盘价
3        high        float     最高价
4         low        float     最低价
5       close        float     收盘价
6         vol       double  成交量(股)
7      amount       double  成交额(元)
Check and display an overview of all local data saved in DataSource using qt.get_table_overview()
qt.get_table_overview()
Analyzing local data source tables... depending on size of tables, it may take a few minutes
[########################################]62/62-100.0%  Analyzing completed!or>>>>>ht>or>>
db:mysql://localhost@3306/ts_db
Following tables contain local data, to view complete list, print returned DataFrame
                 Has_data Size_on_disk Record_count Record_start  Record_end
table
trade_calendar     True        2.5MB         76K     1990-10-12   2022-12-31
stock_basic        True        1.5MB          5K           None         None
stock_names        True        2.4MB         13K     1990-12-10   2022-03-21
index_basic        True        4.5MB         11K           None         None
fund_basic         True        8.3MB         17K           None         None
future_basic       True        2.5MB          7K           None         None
opt_basic          True        4.5MB         10K           None         None
stock_15min        True      15.85GB      100.9M       20090105     20220323
stock_30min        True       6.66GB       38.9M       20090105     20220321
stock_hourly       True       3.41GB       38.3M       20090105     20220318
stock_daily        True       1.57GB       12.1M     1990-12-19   2022-03-22
stock_weekly       True      217.9MB        2.4M     1990-12-21   2022-03-18
stock_monthly      True       87.7MB        638K     1990-12-31   2022-02-28
index_15min        True       2.07GB       17.6M       20090105     20220323
index_30min        True       1.12GB        7.6M       20090105     20220318
index_hourly       True      602.0MB        7.1M       20090105     20220113
index_daily        True      357.0MB        2.2M     1990-12-19   2022-03-23
index_weekly       True       56.6MB        611K     1991-07-05   2022-03-18
index_monthly      True       22.5MB        139K     1991-07-31   2022-02-28
fund_hourly        True         16KB           0           None         None
fund_daily         True      165.3MB        1.6M     1998-04-07   2022-03-22
fund_nav           True      973.0MB       15.0M     2000-01-07   2022-03-22
fund_share         True       69.7MB        1.1M     1998-03-27   2022-03-18
fund_manager       True       84.7MB         40K     2000-02-22   2022-03-18
future_daily       True      384.0MB        2.0M     1995-04-17   2022-03-23
options_daily      True      753.0MB        5.3M     2015-02-09   2022-03-23
stock_adj_factor   True      688.0MB       11.0M     1990-12-19   2022-03-23
fund_adj_factor    True      112.7MB        1.9M     1998-04-07   2022-03-23
stock_indicator    True       2.31GB       11.6M     1999-01-01   2022-03-23
stock_indicator2   True      988.0MB        4.8M     2017-06-14   2022-03-23
index_indicator    True        5.5MB         45K     2004-01-02   2022-03-23
index_weight       True      841.9MB       10.5M     2005-04-08   2022-03-17
income             True       94.8MB        189K     1990-12-31   2021-12-31
balance            True      130.0MB        172K     1989-12-31   2021-12-31
cashflow           True      111.9MB        186K     1998-12-31   2021-12-31
financial          True      373.0MB        152K     1989-12-31   2021-12-31
forecast           True       50.6MB         86K     1998-12-31   2022-12-31
express            True        4.5MB         23K     2004-12-31   2021-12-31
HistoryPanel 与 get_history_data
In qteasy 2.x, qt.get_history_data() is recommended to return a HistoryPanel directly:
import qteasy as qt

hp = qt.get_history_data(
    htypes='open, high, low, close, vol',
    shares='000300.SH,000905.SH',
    start='20230101',
    end='20231231',
)
print(hp)
HistoryPanel is a 3-D container with axes:
axis 0 (shares): instrument list, e.g. stock or index codes
axis 1 (hdates): time axis — one row per timestamp
axis 2 (htypes): history data types such as
open,high,low,close,vol
Slicing with hp[...] returns a sub-HistoryPanel with correct axis labels, not a raw ndarray. Use hp['close'].values or hp['close'].to_numpy(copy=True) for arrays; see hp.subpanel(..., copy=True) for named slices and copy behavior.
For research masks and APIs with mask=, use hp.where(condition) — a bool array matching hp.values without mutating hp. See HistoryPanel API and HistoryPanel tutorial.
Since 2.2.8: read-only column attributes (hp.close ≡ hp['close']); comparisons (hp.close > 100) yield numpy bool arrays for hp.where(...); time filtering via hp.loc[key] (≡ hp[:, :, key]). See API “column access, comparisons, and loc” and tutorial §6.1.
Strategies and visualization share one structured object without repeated conversions.
Adapt existing DataFrame or dict data with qt.dataframe_to_hp() and reuse the same API.
From HistoryPanel to Visualization
HistoryPanel.plot() picks chart types (candlestick, volume, MACD, line) from existing htypes and supports multi-instrument comparison:
import qteasy as qt

hp = qt.get_history_data(
    htypes='open, high, low, close, vol',
    shares='000300.SH',
    start='20230101',
    end='20231231',
)

# 静态 K 线 + 成交量
hp.plot(interactive=False)

# 交互式 K 线(在 Jupyter 中体验更好)
hp.plot(interactive=True)
HistoryPanel.plot Interactive Visualization (Plotly)
hp.plot(interactive=True) uses Plotly with zoom, pan, and hover. In notebooks, FigureWidget (needs ipywidgets and anywidget) is preferred; otherwise HTML fallback. Set `plotly_backend_app=’auto’|’FigureWidget’|’html’ explicitly if needed.
Dependencies and Installation
Basic interactivity (Plotly Figure):
pip install plotly
Full notebook interactivity (FigureWidget + callbacks):
pip install ipywidgets anywidget
If Plotly is missing, interactive=True raises an English error (e.g. “requires plotly”) so missing dependencies fail early instead of producing a non-interactive empty chart.
plotly_backend_app: output mode and fallback
plotly_backend_app applies only when interactive=True:
plotly_backend_app='auto': prefer FigureWidget in notebooks; else HTML wrapper; may return raw Plotly Figure in scripts.plotly_backend_app='FigureWidget': force FigureWidget; error if not in notebook or deps missing.plotly_backend_app='html': force HTML wrapper; error if not in notebook.
Key Interactive Features (User View)
Zoom/pan consistency: HTML and FigureWidget share x-axis constraints — minimum visible bars, pan back into data range when out of bounds.
Top OHLC summary: shown when full OHLC candlestick main chart exists; starts at last bar, updates on click. Hidden for line-only charts (e.g. close only).
layout='overlay'for two instruments: clicking a bar switches primary/secondary; opacity and line width update;highlightfollows the primary instrument.Selection crosshair: shown on the main price chart after click; syncs on zoom/pan; hidden when the selected bar scrolls out of view.
Examples: Two Common Interactive Calls
Example 1: single-instrument interactive candlestick
hp.plot(interactive=True, plotly_backend_app='auto')
Example 2: two-instrument overlay + highlight
hp2 = qt.get_history_data(
    htypes='open, high, low, close, vol',
    shares='000300.SH,000905.SH',
    start='20230101',
    end='20231231',
)
hp2.plot(
    interactive=True,
    layout='overlay',
    highlight='max',
    plotly_backend_app='html',
)
Visualization follows “plot what exists”:
Only columns already in the HistoryPanel — no new indicators computed in the plot layer
Candlestick, volume, or MACD depends solely on corresponding htypes present
Typical htype-to-chart mapping:
Chart type |
Example htypes required |
|---|---|
Candlestick |
|
Volume |
|
MACD |
|
Line chart |
Any 1-D series (e.g. |
For MA/Bollinger/MACD, compute on HistoryPanel (hp.kline.ma(), hp.kline.bbands(), hp.kline.macd()), append columns, then hp.plot().
Relationship between qt.candle and HistoryPanel
qt.candle() is a high-level shortcut to plot one instrument’s candlestick in one line:
Parse
stock,start,end, fetch from local DataSourceAdapt prices to a single-instrument HistoryPanel
Append requested indicators (MA, Bollinger, MACD) on HistoryPanel
Call
hp.plot(...)to render
Keep existing qt.candle calls or control plotting directly on HistoryPanel.
Common usage examples:
import qteasy as qt

# 快速绘制日 K 线(内部走 HistoryPanel 可视化)
df = qt.candle(
    stock='000300.SH',
    start='2023-06-01',
    end='2023-12-01',
    asset_type='IDX',
    plot_type='candle',
    interactive=True,
)

print(df.head())  # df 为用于绘图的价格数据
plot_type values:
'candle'/'c': OHLC candlestick'ohlc'/'o': lightweight alias near'candle''line'/'l': 1-D price line (usuallyclose)'none'/'n': data only, returnDataFramefor external plotting
Renko ('renko' / 'r') is no longer built in; use a dedicated TA/charting library.
Acquire historical data and save it in DataSource
If there is no data in DataSource, it will be difficult for qteasy to play its role. Therefore, the first step is to save the data in DataSource. DataSource class provides the _fetch_table_data_from_tushare() function to acquire and store historical data in DataSource. In the parameters of this function, you can directly provide a DataFrame, a csv file name, or an excel file name. You can also connect to the API of the network data provider to acquire data. The methods to acquire and update data using the DataSource object include:
DataSource.update_table_data()
Inspect the input df, remove the columns or rows that do not meet the requirements, and merge the data into the table, including the following steps:
Inspect whether the column names of the downloaded data table are the same as the definition of the data table, and delete the extra columns
If the datasource type is “db”, delete the part of the downloaded data that is duplicated with the local data, and only keep the new data
If the datasource type is “file”, merge the downloaded data with the local data and remove duplicates
DataSource.read_table_data()
Acquire data through local files and save it in DataSource:
Following example code saves the data stored in DataFrame in DataSource
# stock_data 是事先准备好的股票价格数据,格式为pd.DataFrame
df = ds_csv._fetch_table_data_from_tushare(table='stock_basic', channel='df', df=stock_data)
ds_csv.update_table_data('stock_basic', df)
ds_csv.table_data_exists('stock_basic')
Local Data Access and Visualization
Once data is local, fetch it easily; OHLCV can be visualized as candlesticks or lines
Basic security information
qt.get_basic_info(code_or_name: str, asset_types=None, match_full_name=False, printout=True, verbose=False)
get_basic_info(code_or_name) accepts code or name; global match lists all hits unless asset_type narrows scope; match_full_name=True fuzzy-matches full names
qt.get_stock_info(code_or_name: str, asset_types=None, match_full_name=False, printout=True, verbose=False)
Alias of get_basic_info()
Filter stock codes
qt.filter_stocks(date: str = 'today', **kwargs)
Filter stocks by listing date, region, industry, size, index membership, etc., and print info
qt.filter_stock_codes(date: str = 'today', **kwargs)
Same filters, return full stock codes
Extract historical financial data
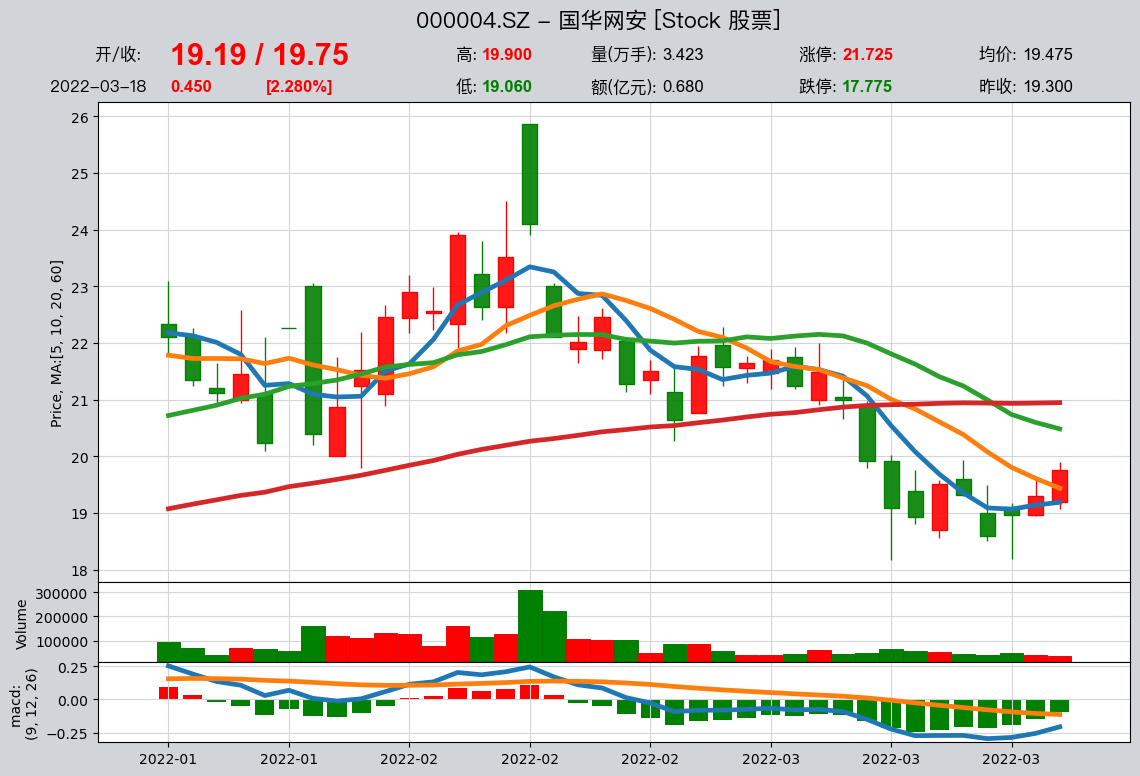
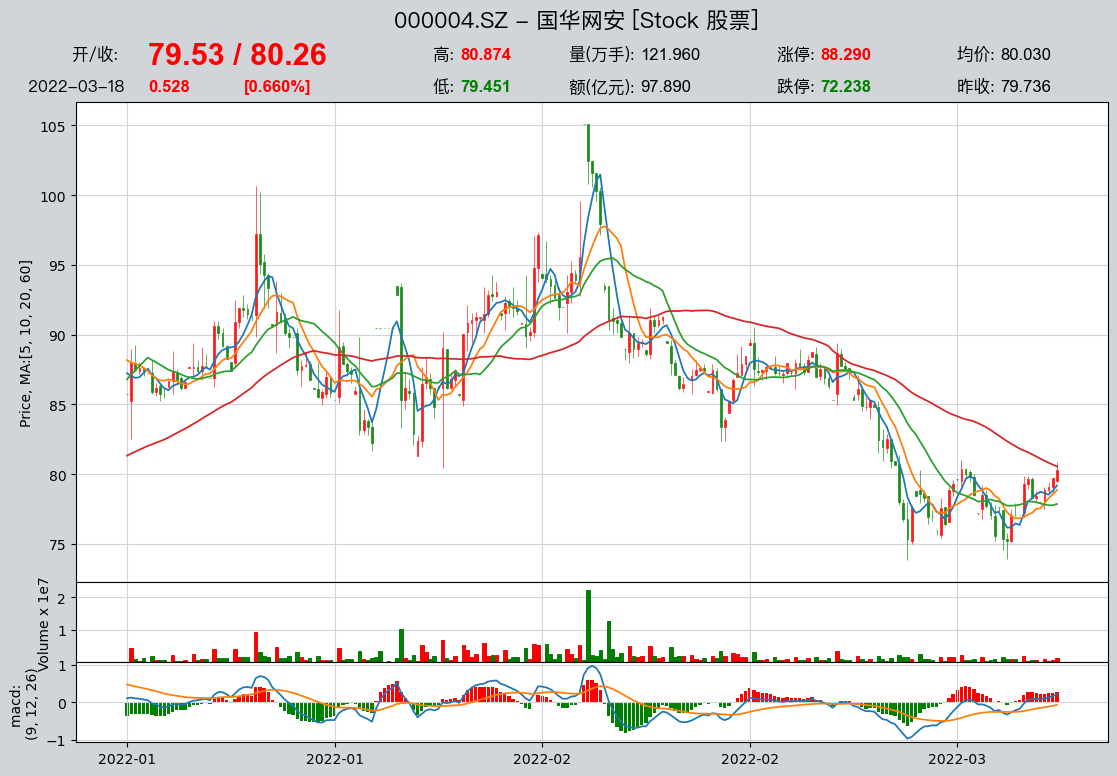
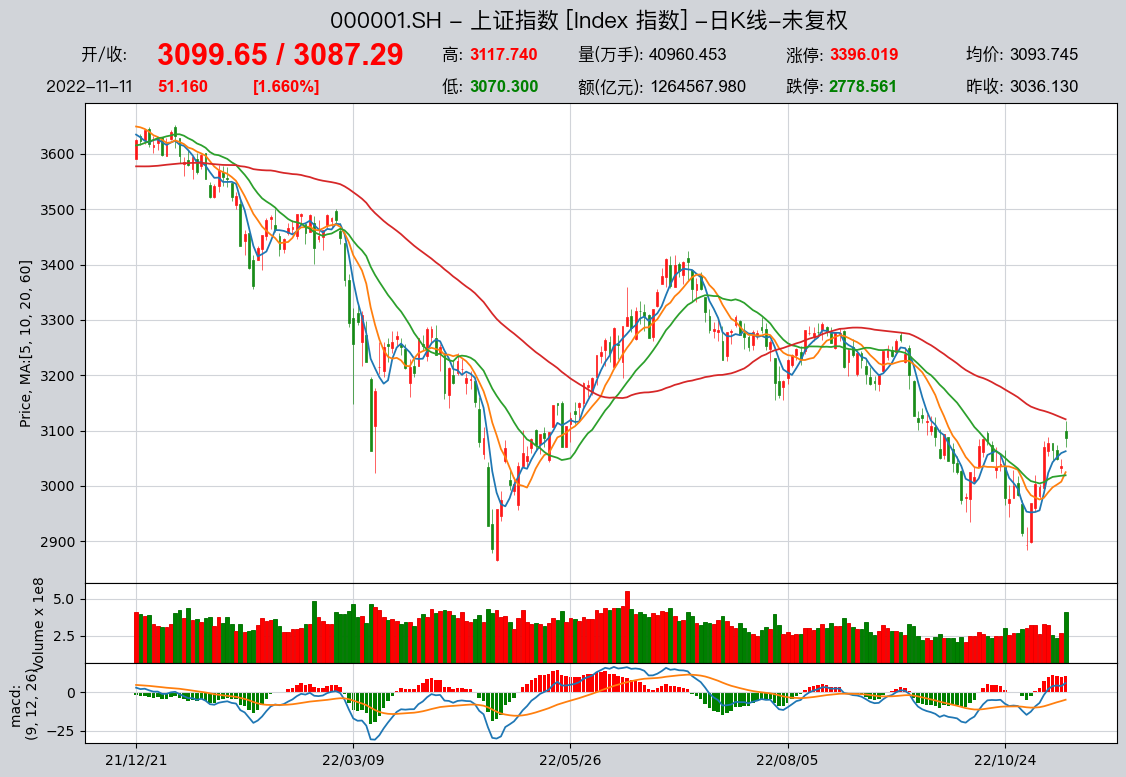
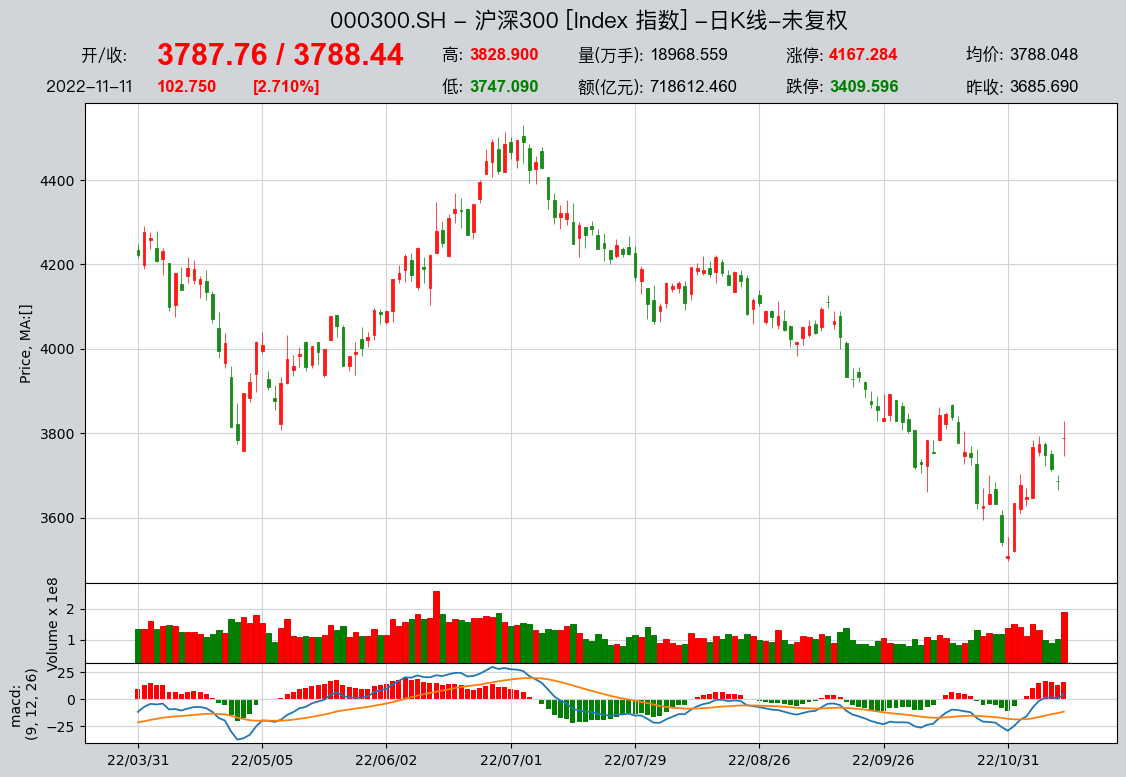
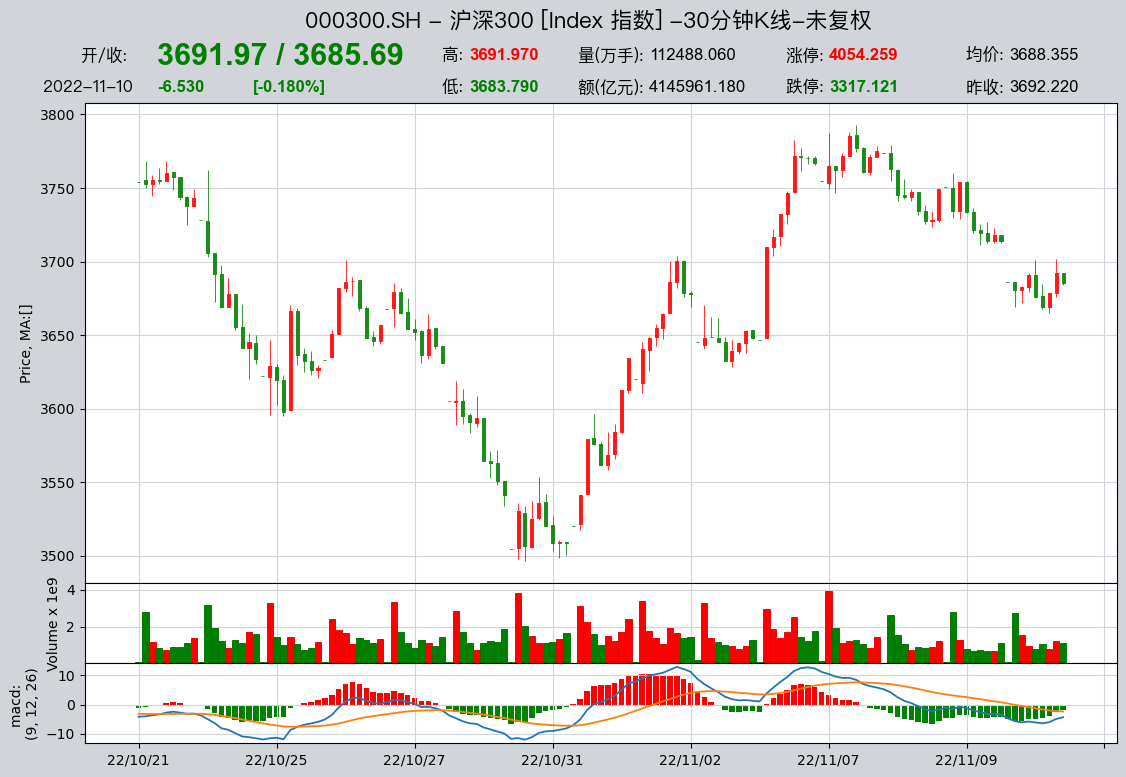
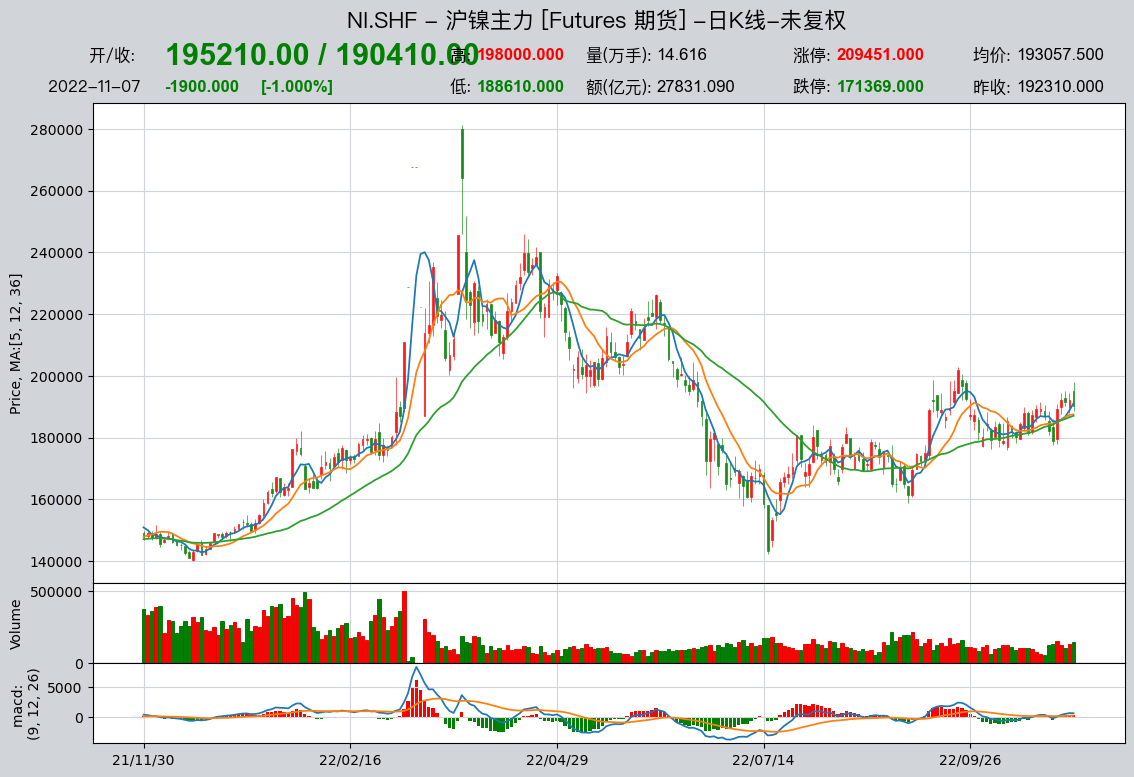
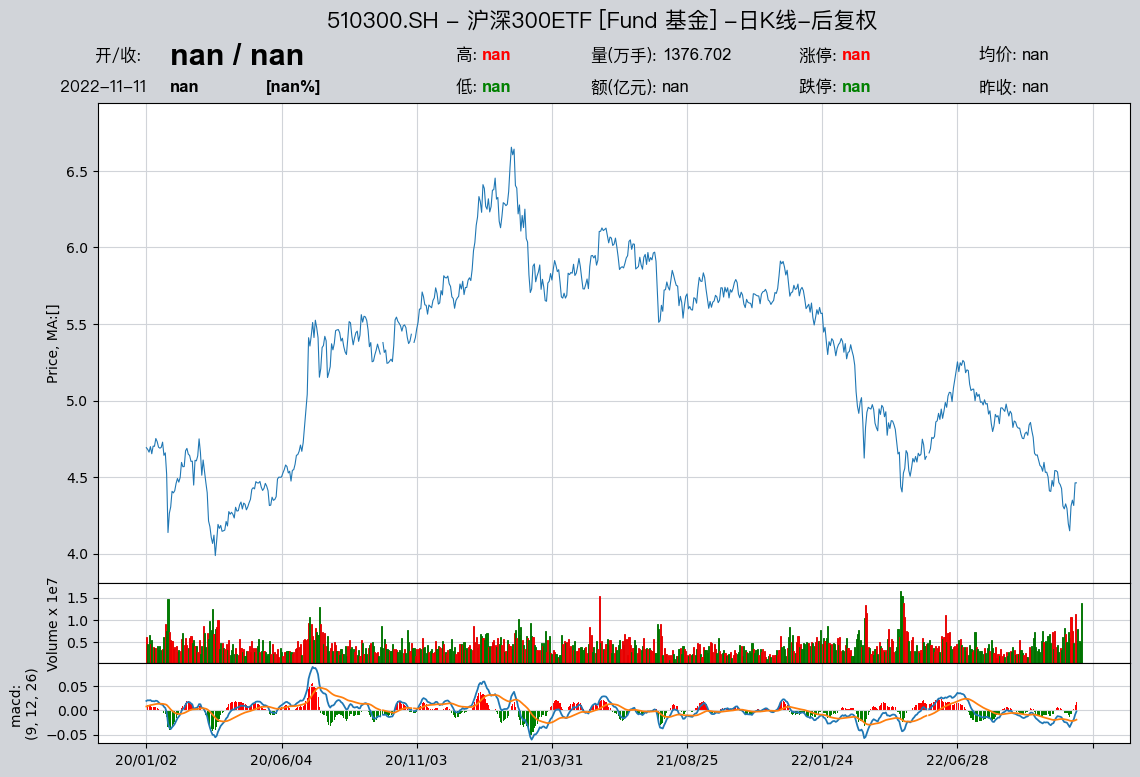
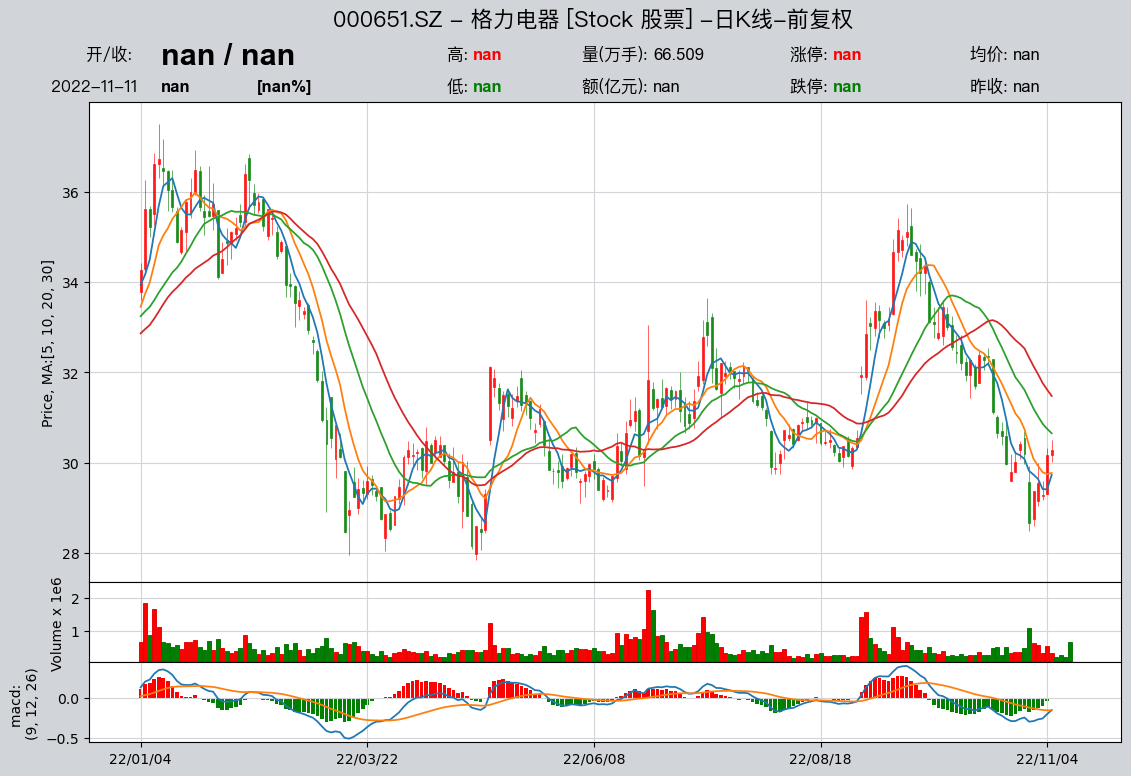
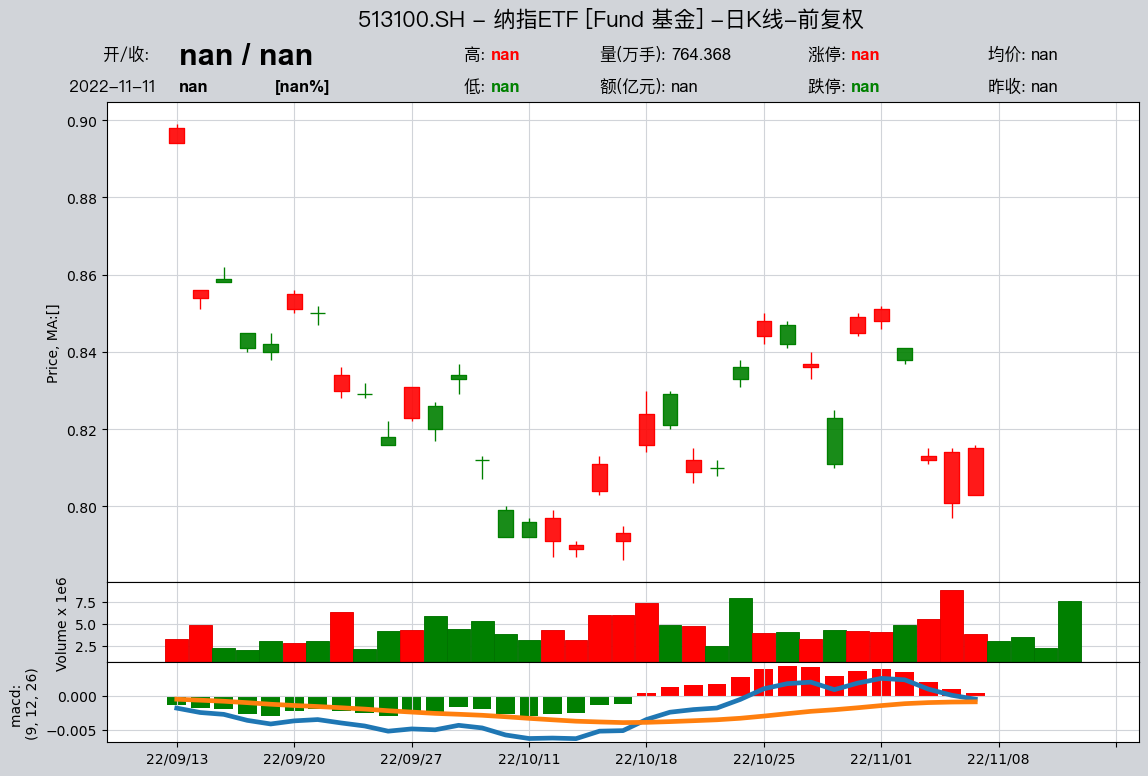
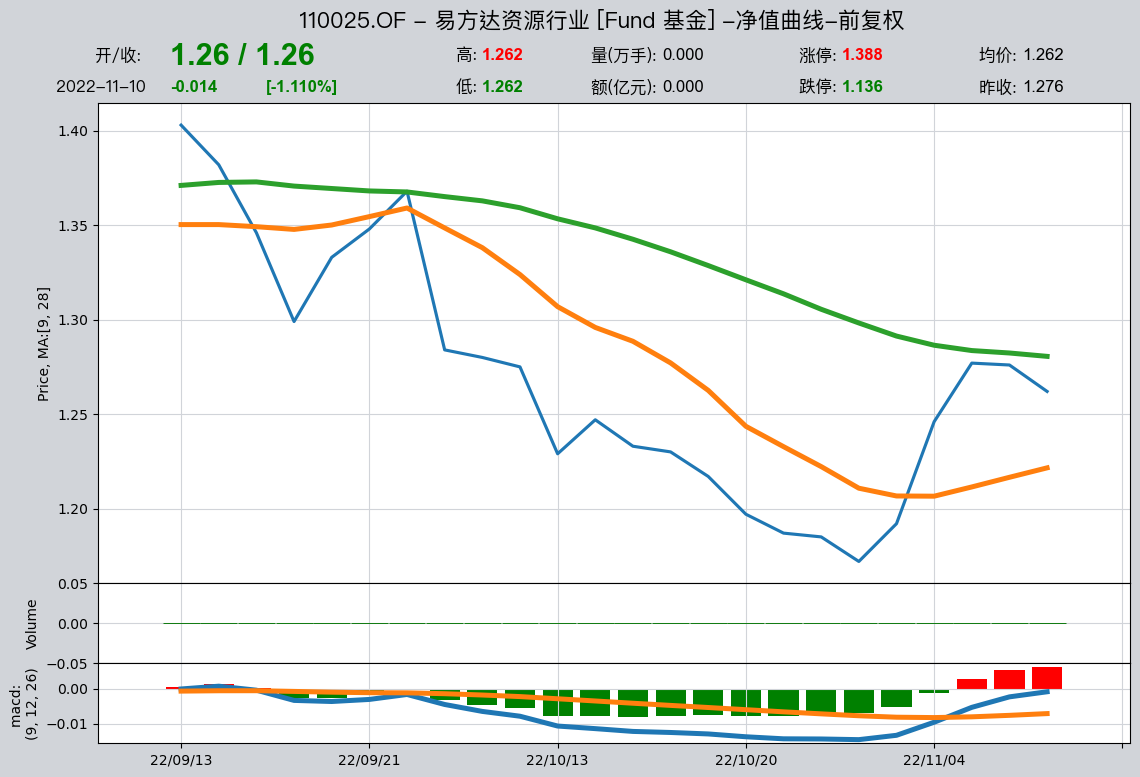
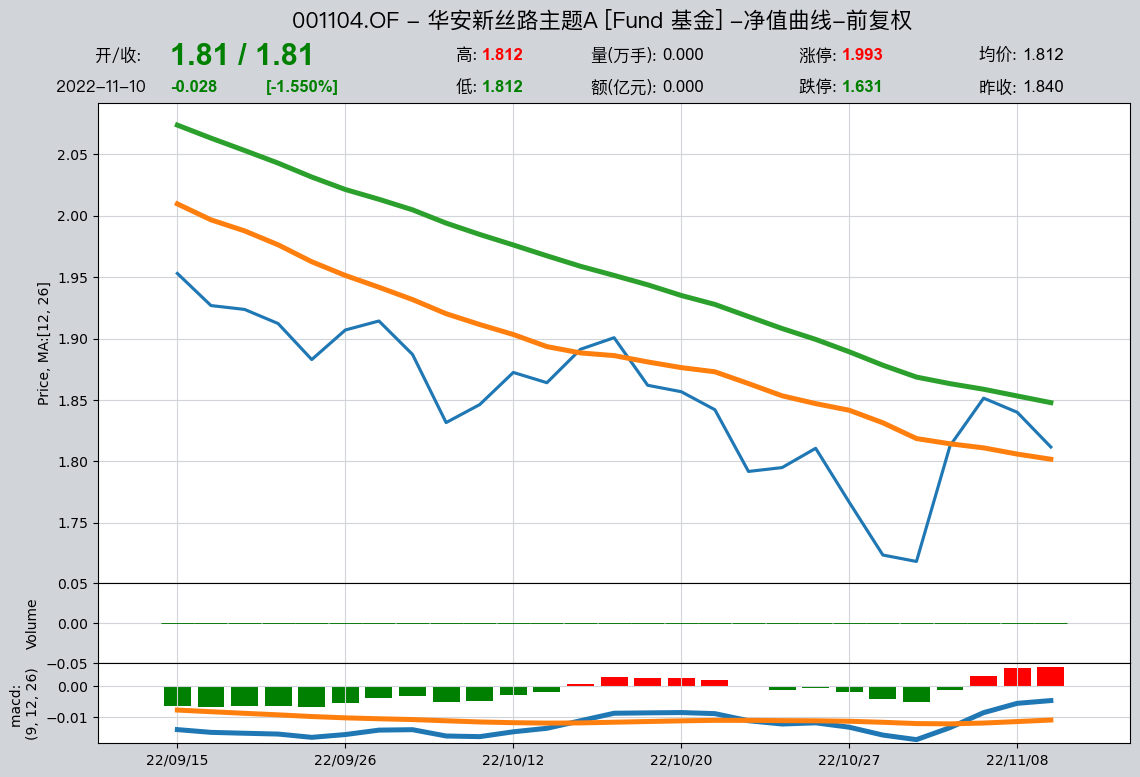
OHLCV visualization
qt.candle(stock=None, start=None, end=None, stock_data=None, asset_type=None, freq=None, plot_type='candle', interactive=True, data_source=None, **kwargs)
Fetch local price data and render a full dynamic advanced candlestick chart
Example:
Look up basic security information
With data in DataSource, qt.get_basic_info() finds securities by six-digit code or name (fuzzy or wildcard search supported)
Example: lookup by six-digit code
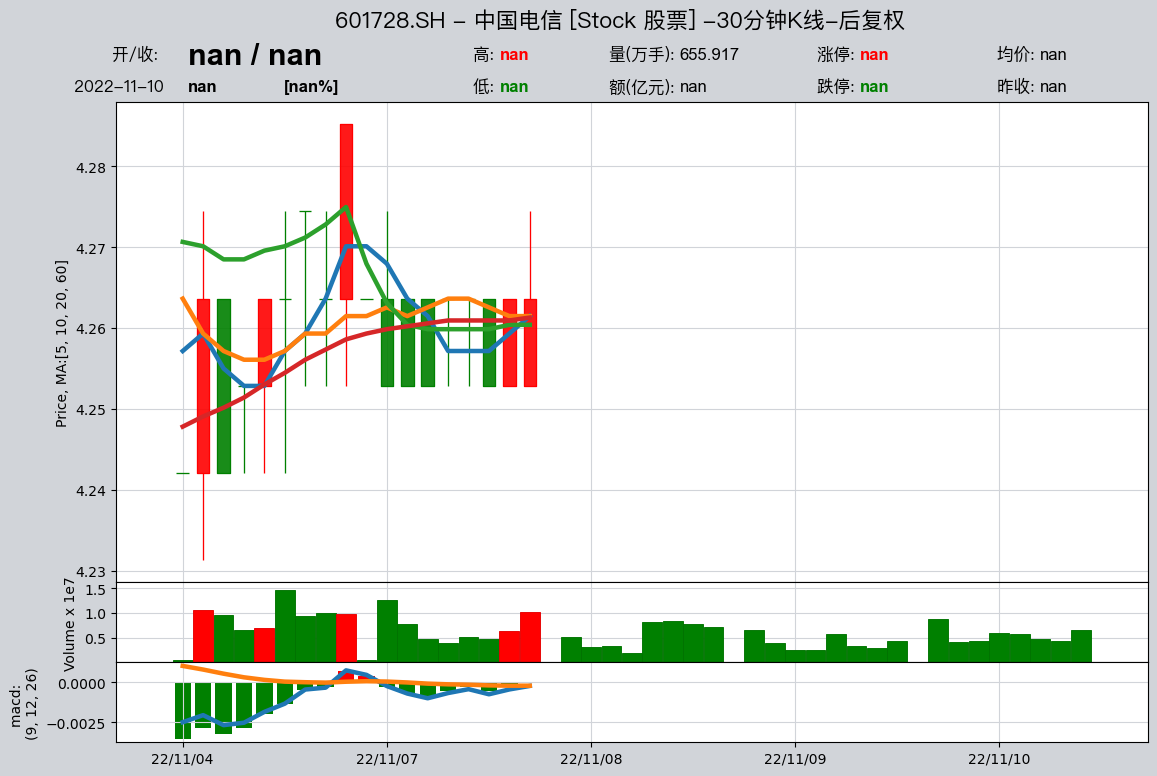
qt.get_basic_info('601728')
found 1 matches, matched codes are {'E': {'601728.SH': '中国电信'}, 'IDX': {}, 'FT': {}, 'FD': {}, 'OPT': {}, 'count': 1}
More information for asset type E:
------------------------------------------
ts_code       601728.SH
name               中国电信
area                 北京
industry           电信运营
fullname     中国电信股份有限公司
list_status           L
list_date    2021-08-20
-------------------------------------------
Or search by name — fuzzy match may return multiple hits, e.g.:
qt.get_basic_info('中国证券')
Too many matched codes 128, best matched are
{'E': {'000728.SZ': '国元证券'}, 'IDX': {'100630.CIC': '中金证券'}, 'FD': {'001552.OF': '天弘中证证券保险A'}}
pass "verbose=Ture" to view all matched assets
More information for asset type E:
------------------------------------------
ts_code       000728.SZ
name               国元证券
area                 安徽
industry             证券
fullname     国元证券股份有限公司
list_status           L
list_date    1997-06-16
-------------------------------------------
More information for asset type IDX:
------------------------------------------
ts_code   100630.CIC
name            中金证券
fullname      中金证券指数
publisher       中金公司
category          其他
list_date       None
-------------------------------------------
More information for asset type FD:
------------------------------------------
ts_code        001552.OF
name           天弘中证证券保险A
management          天弘基金
custodian           国泰君安
fund_type            股票型
issue_date    2015-06-29
issue_amount        0.05
invest_type        被动指数型
type              契约型开放式
-------------------------------------------
Wildcard search by name is supported
qt.get_basic_info('中国?通')
found 2 matches, matched codes are {'E': {'600050.SH': '中国联通', '601698.SH': '中国卫通'}, 'IDX': {}, 'FD': {}, 'count': 2}
More information for asset type E:
------------------------------------------
ts_code           600050.SH     601698.SH
name                   中国联通          中国卫通
area                     北京            北京
industry               电信运营          电信运营
fullname     中国联合网络通信股份有限公司  中国卫通集团股份有限公司
list_status               L             L
list_date        2002-10-09    2019-06-28
-------------------------------------------
By default full names are not matched; set full-name matching when needed, e.g.:
# 使用‘贵州钢绳’为关键字搜索股票代码,不匹配全名时,找不到匹配的结果:
qt.get_basic_info('贵州钢绳')
Output:
found 0 matches, matched codes are {'E': {}, 'IDX': {}, 'FD': {}, 'count': 0}
# 然而如果设置了匹配全名`match_full_name=True`,则能够找到匹配的代码:
qt.get_basic_info('贵州钢绳', match_full_name=True)
Output:
found 1 matches, matched codes are {'E': {'600992.SH': '贵绳股份'}, 'IDX': {}, 'FD': {}, 'count': 1}
More information for asset type E:
------------------------------------------
ts_code       600992.SH
name               贵绳股份
area                 贵州
industry            钢加工
fullname     贵州钢绳股份有限公司
list_status           L
list_date    2004-05-14
-------------------------------------------
qt.filter_stocks filters stocks by criteria, e.g.:
# 筛选2000年以后发行的HS300指数成份股
qt.filter_stocks(date = '20000101', index='000300.SH')
| symbol | name | area | industry | market | list_date | exchange | |
|---|---|---|---|---|---|---|---|
| ts_code | |||||||
| 000001.SZ | 000001 | 平安银行 | 深圳 | 银行 | 主板 | 1991-04-03 | SZSE |
| 000002.SZ | 000002 | 万科A | 深圳 | 全国地产 | 主板 | 1991-01-29 | SZSE |
| 000063.SZ | 000063 | 中兴通讯 | 深圳 | 通信设备 | 主板 | 1997-11-18 | SZSE |
| 000069.SZ | 000069 | 华侨城A | 深圳 | 旅游景点 | 主板 | 1997-09-10 | SZSE |
| 000100.SZ | 000100 | TCL科技 | 广东 | 元器件 | 主板 | 2004-01-30 | SZSE |
| ... | ... | ... | ... | ... | ... | ... | ... |
| 603486.SH | 603486 | 科沃斯 | 江苏 | 家用电器 | 主板 | 2018-05-28 | SSE |
| 605499.SH | 605499 | 东鹏饮料 | 深圳 | 软饮料 | 主板 | 2021-05-27 | SSE |
| 688561.SH | 688561 | 奇安信-U | 北京 | 软件服务 | 科创板 | 2020-07-22 | SSE |
| 688599.SH | 688599 | 天合光能 | 江苏 | 电气设备 | 科创板 | 2020-06-10 | SSE |
| 688981.SH | 688981 | 中芯国际 | 上海 | 半导体 | 科创板 | 2020-07-16 | SSE |
397 rows × 7 columns