1. Double MA Timing
Reference source: docs/_joinquant_migration_source/Example_01_Double Moving Average Timing Strategy.ipynb First Markdown cell.
This strategy establishes a double moving average trading model based on the daily K-line data of the trading target, and the trading strategy is as follows:
The strategy contains two parameters: the number of days in the short period S and the number of days in the long period L. Calculate the moving average of the closing price of the daily K-line of the trading target with two different periods to obtain two moving averages. The moving average calculated with S as the period is the fast moving average, and the moving average calculated with L as the period is the slow moving average. Generate trading signals according to the cross situation of the fast and slow moving averages:
When the fast moving average crosses the slow moving average from bottom to top, the trading target is fully bought
When the fast moving average crosses the short moving average from top to bottom, close the position
Simulated backtesting trading:
Backtest data: Shanghai and Shenzhen 300 Index (000300.SH)
Backtest period: January 1, 2011 to December 31, 2020
Generate trading result charts
Strategy parameter optimization:
Use the HS300 index in the historical interval of ten years from 2011 to 2020 to search for the best strategy parameters
Test on data from 2020 to 2022
Output test results of 30 best parameters
1.1. First, import the qteasy module.
import qteasy as qt
1.2. Create a new strategy
Use the qt.RuleIterator strategy base class to create a rule iteration strategy. This strategy can apply the same rule iteration to all stocks in the portfolio, which is suitable for applying the same timing rule to all stocks in a portfolio.
from qteasy import Parameter, StgData
from qteasy import RuleIterator
# 创建双均线交易策略类
class Cross_SMA_PS(RuleIterator):
    """自定义双均线择时策略策略,产生的信号类型为交易信号
        这个均线择时策略有两个参数:
            - FMA 快均线周期
            - SMA 慢均线周期
        策略跟踪上述两个周期产生的简单移动平均线,当两根均线发生交叉时
        直接产生交易信号。
    """
    def __init__(self, **kwargs):
        """
        初始化交易策略的参数信息和基本信息
        """
        super().__init__(
            pars=[Parameter((10, 100), name='fast', par_type='int', value=10),
                  Parameter((30, 180), name='slow', par_type='int', value=160)],
            # 策略只有长短周期两个参数, 均为整型变量
            name='CROSSLINE',  # 策略的名称
            description='快慢双均线择时策略',  # 策略的描述
            data_types=StgData('close', freq='d', asset_type='ANY', window_length=200),  # 策略基于收盘价计算均线,因此数据类型为'close', 历史数据窗口长度为200
            **kwargs,
        )

    def realize(self):
        """策略的具体实现代码:
         - f: fast, 短均线计算日期;
         - s: slow: 长均线计算日期;
        """
        from qteasy.tafuncs import sma
        # 获取传入的策略参数
        f, s = self.get_pars('fast', 'slow')
        # 获取历史数据日频收盘价,计算长短均线的当前值和昨天的值
        close = self.get_data('close_ANY_d')
        # 使用qt.sma计算简单移动平均价
        s_ma = sma(close, s)
        f_ma = sma(close, f)

        # 为了考察两条均线的交叉, 计算两根均线昨日和今日的值,以便判断
        s_today, s_last = s_ma[-1], s_ma[-2]
        f_today, f_last = f_ma[-1], f_ma[-2]

        # 根据观望模式在不同的点位产生交易信号
        # 在PS信号类型下,1表示全仓买入,-1表示卖出全部持有股份
        # 当快均线自下而上穿过上边界,发出全仓买入信号
        if (f_last <= s_last) and (f_today >= s_today):
            return 1
        # 当快均线自上而下穿过上边界,发出全部卖出信号
        elif (f_last >= s_last) and (f_today <= s_today):
            return -1
        else:  # 其余情况不产生任何信号
            return 0
1.3. Backtest trading strategy and view results
After defining the strategy, define an Operator object that references the strategy just created. Set the trader’s signal mode to PS according to the strategy’s rules. PS represents a proportional trading signal; in this mode, the signal ranges from -1 to 1, where 1 represents a full buy, -1 represents a full sell, and 0 represents no action. Backtest the trading strategy using historical data. After generating trading signals using historical data, conduct simulated trading, record and analyze the trading results.
stg = Cross_SMA_PS()
op = qt.Operator([stg], signal_type='PS')

# 设置op的策略参数
op.set_parameter(0, par_values= (10, 160))  # 设置快慢均线周期分别为10天、166天
op.set_group_parameters('Group_1', blender_str='s0')
# 设置基本回测参数,开始运行模拟交易回测
res = qt.run(op,
             mode=1,  # 运行模式为回测模式
             asset_pool='000300.SH',  # 投资标的为000300.SH即沪深300指数
             invest_start='20110101',  # 回测开始日期
             visual=True,  # 生成交易回测结果分析图
             trade_batch_size=0.01,
             sell_batch_size=0.01,
            )
Results of trading are as follows:
====================================
| |
| BACKTEST REPORT |
| |
====================================
qteasy running mode: 1 - History back testing
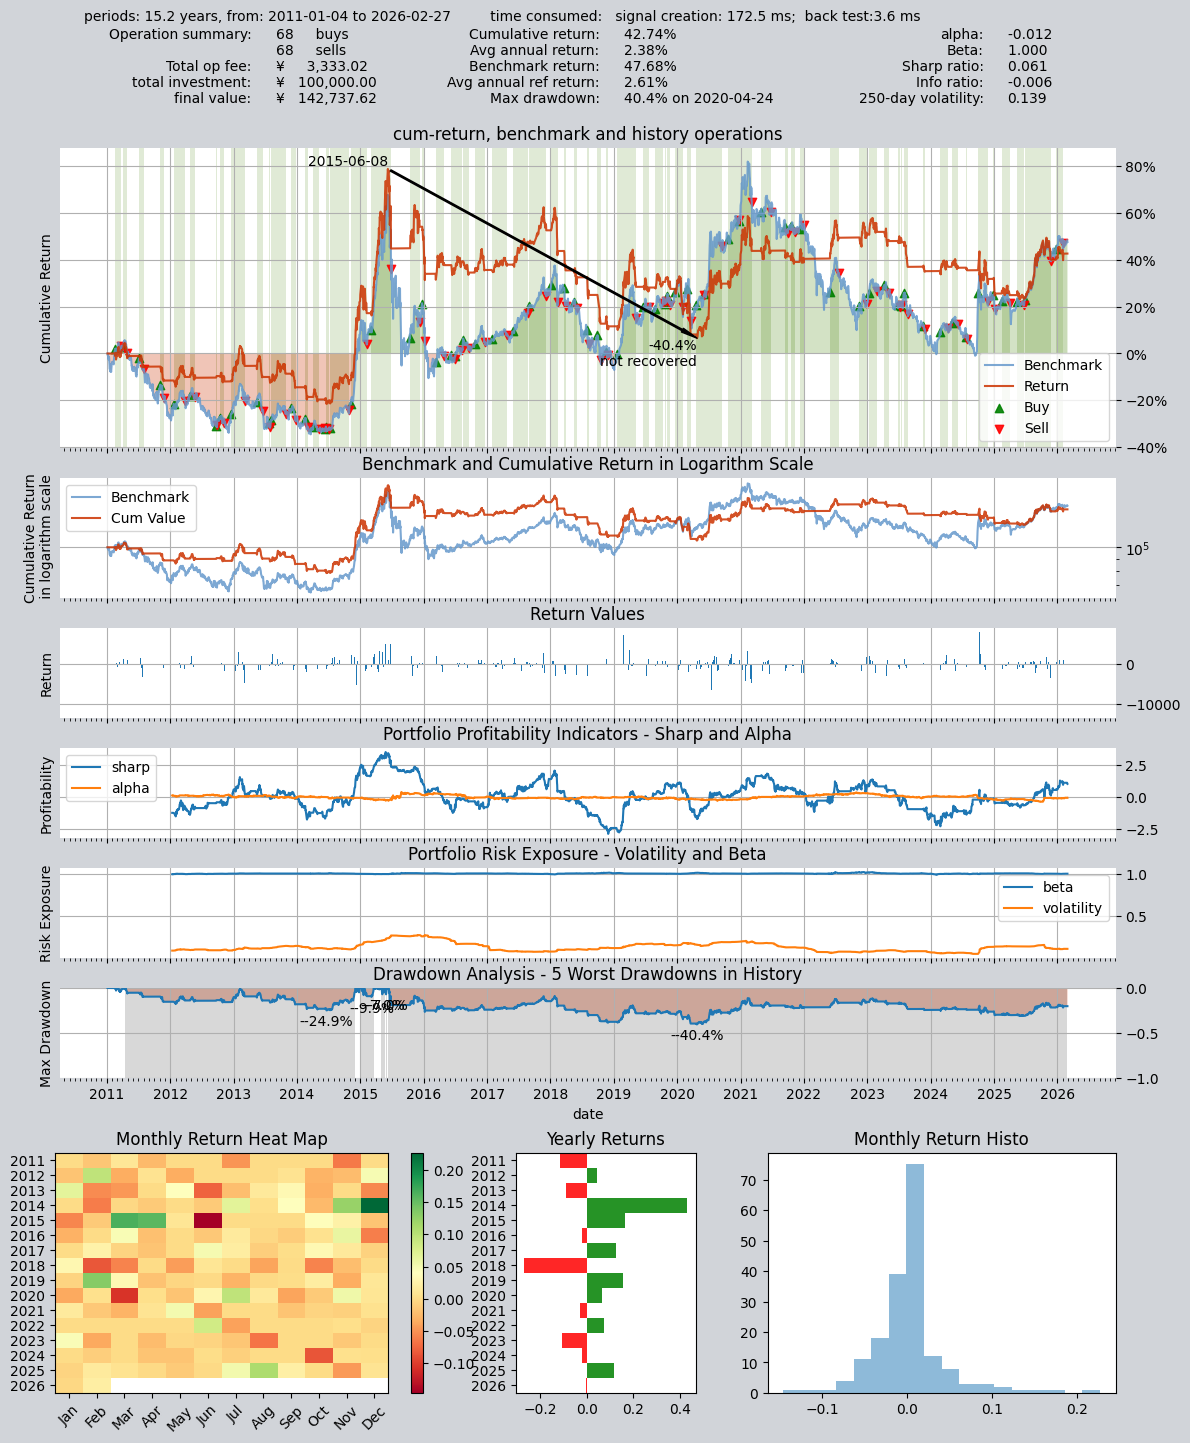
time consumption for operate signal creation: 172.5 ms
time consumption for operation back testing: 3.6 ms
investment starts on 2011-01-04 15:00:00
ends on 2026-02-27 15:00:00
Total looped periods: 15.2 years.
-------------operation summary:------------
Only non-empty shares are displayed, call
"loop_result["oper_count"]" for complete operation summary
Sell Cnt Buy Cnt Total Long pct Short pct Empty pct
000300.SH 68 68 136 55.2% -0.0% 44.8%
Total operation fee: ¥ 3,333.02
total investment amount: ¥ 100,000.00
final value: ¥ 142,737.62
Total return: 42.74%
Avg Yearly return: 2.38%
Skewness: -0.91
Kurtosis: 13.80
Benchmark return: 47.68%
Benchmark Yearly return: 2.61%
------strategy loop_results indicators------
alpha: -0.012
Beta: 1.000
Sharp ratio: 0.061
Info ratio: -0.006
250 day volatility: 0.139
Max drawdown: 40.45%
peak / valley: 2015-06-08 / 2020-04-24
recovered on: Not recovered!
==================END OF REPORT===================
As can be seen from the above trading results, there were 68 buys and 68 sells over ten years, with a holding period of 55%, resulting in a final return of only 42.7%.
Here is a visual display of the trading results
Cross-line trading strategy is very important to choose the long and short periods, you can use qteasy to search for the best strategy parameters:
1.4. Optimization of strategy parameters
We can search for the optimal policy parameters on historical data, find the parameter combinations that perform best on historical data, and examine their performance on independent test intervals to check for overfitting.
op.set_parameter(0,
                 opt_tag=1  # 将op中的策略设置为可优化,如果不这样设置,将无法优化策略参数
                )
res = qt.run(op,
             mode=2,
             opti_start='20110101',  # 优化区间开始日期
             opti_end='20200101',  # 优化区间结束日期
             test_start='20200101',  # 独立测试开始日期
             test_end='20220101',  # 独立测试结束日期
             opti_sample_count=1000,  # 一共进行1000次搜索
             opti_method='SA',  # 优化方法为模拟退火算法
             parallel=False,  # 不启用并行搜索
            )
Optimizing the strategy may take a long time, and qt will display a progress bar:
Epoch:1/5->175917.941: 100%|█████████████████████████████████████████████████| 128/128 [00:08<00:00, 15.94it/s]
Epoch:2/5->183493.313: 100%|█████████████████████████████████████████████████| 128/128 [00:07<00:00, 16.43it/s]
Epoch:3/5->203089.648: 100%|█████████████████████████████████████████████████| 128/128 [00:07<00:00, 16.59it/s]
Epoch:4/5->187650.270: 100%|█████████████████████████████████████████████████| 128/128 [00:07<00:00, 16.46it/s]
Epoch:5/5->205538.237: 100%|█████████████████████████████████████████████████| 128/128 [00:07<00:00, 16.57it/s]
Epoch:1/1->411083.340: 100%|███████████████████████████████████████████████████| 30/30 [00:04<00:00,  7.04it/s]
Optimization is complete, showing the best 30 sets of parameters and related information:
====================================
|                                  |
|       OPTIMIZATION REPORT        |
|                                  |
====================================
qteasy running mode: 2 - Strategy Parameter Optimization
time consumption for optimization: 39 sec 103.0 ms
time consumption for evaluation:   4 sec 261.2 ms
investment starts on 2011-01-04 15:00:00
ends on 2019-12-31 15:00:00
Total looped periods: 9.0 years.
total investment amount: ¥   100,000.00
Benchmark type is 000300.SH
Total Benchmark rtn: 28.43%
Average Yearly Benchmark rtn rate: 2.82%
Statistical analysis of optimal strategy messages indicators:
Total return:        270.25% ± 13.73%
Annual return:       15.66% ± 0.46%
Alpha:               -0.277 ± 0.466
Beta:                -0.459 ± 2.175
Sharp ratio:         0.434 ± 0.069
Info ratio:          0.011 ± 0.002
250 day volatility:  0.145 ± 0.008
Other messages indicators are listed in below table
   Strategy items Sell-outs Buy-ins ttl-fee      FV      ROI    MDD
0     (43, 144)       5.0      6.0    509.43 358,315.55 258.3% 31.6%
1     (29, 171)       5.0      6.0    498.98 358,659.37 258.7% 31.6%
2      (72, 84)      17.0     18.0  1,786.90 359,602.66 259.6% 43.8%
3      (72, 84)      17.0     18.0  1,786.90 359,602.66 259.6% 43.8%
4     (35, 151)       5.0      6.0    510.77 360,689.42 260.7% 31.6%
5      (77, 81)      29.0     30.0  3,111.64 362,208.28 262.2% 44.0%
6      (77, 81)      29.0     30.0  3,111.64 362,208.28 262.2% 44.0%
7      (80, 91)      15.0     16.0  1,519.87 362,252.85 262.3% 45.8%
8     (24, 176)       5.0      6.0    505.68 362,696.68 262.7% 31.6%
9     (24, 176)       5.0      6.0    505.68 362,696.68 262.7% 31.6%
10    (36, 150)       5.0      6.0    510.71 362,666.50 262.7% 31.6%
11    (11, 156)      11.0     12.0  1,005.55 362,714.28 262.7% 31.9%
12     (58, 83)      12.0     13.0  1,218.41 363,195.61 263.2% 43.2%
13    (31, 169)       6.0      7.0    566.80 363,756.82 263.8% 31.6%
14    (36, 151)       5.0      6.0    514.33 364,408.58 264.4% 31.6%
15    (28, 173)       5.0      6.0    505.27 365,648.99 265.6% 31.6%
16     (73, 83)      16.0     17.0  1,678.20 366,055.42 266.1% 43.6%
17    (32, 171)       4.0      5.0    452.30 366,955.25 267.0% 31.6%
18    (13, 156)      10.0     11.0    903.07 367,001.52 267.0% 31.8%
19     (73, 84)      17.0     18.0  1,767.40 368,221.99 268.2% 43.8%
20     (77, 82)      25.0     26.0  2,725.38 368,871.74 268.9% 44.7%
21     (77, 82)      25.0     26.0  2,725.38 368,871.74 268.9% 44.7%
22     (81, 91)      15.0     16.0  1,560.50 374,068.95 274.1% 44.4%
23     (76, 81)      25.0     26.0  2,730.01 375,311.56 275.3% 43.9%
24     (73, 85)      16.0     17.0  1,708.08 379,569.28 279.6% 44.0%
25    (12, 155)      11.0     12.0    992.25 381,190.46 281.2% 31.6%
26     (76, 84)      21.0     22.0  2,181.56 382,247.74 282.2% 44.6%
27     (77, 86)      16.0     17.0  1,719.80 400,385.81 300.4% 43.2%
28     (78, 85)      22.0     23.0  2,393.91 406,202.21 306.2% 43.2%
29     (80, 86)      21.0     22.0  2,386.87 411,083.34 311.1% 41.6%

==================END OF REPORT===================
These thirty sets of parameters will be used for independent testing to see if they are overfitting:
Epoch:1/1->259292.734: 100%|███████████████████████████████████████████████████████████| 30/30 [00:01<00:00, 23.02it/s]

====================================
|                                  |
|        VALIDATION REPORT         |
|                                  |
====================================
qteasy running mode: 2 - Strategy Parameter Optimization
time consumption for optimization: 39 sec 103.0 ms
time consumption for evaluation:   4 sec 261.2 ms
investment starts on 2020-01-02 15:00:00
ends on 2021-12-31 15:00:00
Total looped periods: 2.0 years.
total investment amount: ¥   100,000.00
Benchmark type is 000300.SH
Total Benchmark rtn: 18.98%
Average Yearly Benchmark rtn rate: 9.09%
Statistical analysis of optimal strategy messages indicators:
Total return:        115.83% ± 31.89%
Annual return:       46.59% ± 10.98%
Alpha:               -0.081 ± 0.066
Beta:                0.999 ± 0.000
Sharp ratio:         0.545 ± 0.322
Info ratio:          -0.038 ± 0.047
250 day volatility:  0.178 ± 0.004
Other messages indicators are listed in below table
   Strategy items Sell-outs Buy-ins ttl-fee     FV      ROI    MDD
0     (43, 144)       1.0      1.0    84.86 248,458.67 148.5% 15.2%
1     (29, 171)       1.0      1.0    85.88 258,545.09 158.5% 15.2%
2      (72, 84)       2.0      3.0   224.59 195,264.51  95.3% 20.8%
3      (72, 84)       2.0      3.0   224.59 195,264.51  95.3% 20.8%
4     (35, 151)       3.0      3.0   282.50 241,963.33 142.0% 17.0%
5      (77, 81)      10.0     11.0   792.08 168,647.51  68.6% 24.3%
6      (77, 81)      10.0     11.0   792.08 168,647.51  68.6% 24.3%
7      (80, 91)       4.0      5.0   412.29 218,152.13 118.2% 16.7%
8     (24, 176)       1.0      1.0    85.21 251,880.99 151.9% 15.2%
9     (24, 176)       1.0      1.0    85.21 251,880.99 151.9% 15.2%
10    (36, 150)       3.0      3.0   279.96 238,065.57 138.1% 17.3%
11    (11, 156)       5.0      5.0   448.16 231,744.72 131.7% 19.1%
12     (58, 83)       3.0      4.0   346.95 230,754.45 130.8% 19.8%
13    (31, 169)       1.0      1.0    85.55 255,239.86 155.2% 15.2%
14    (36, 151)       3.0      3.0   279.98 238,344.64 138.3% 17.2%
15    (28, 173)       1.0      1.0    85.59 255,731.20 155.7% 15.2%
16     (73, 83)       6.0      7.0   503.93 183,585.71  83.6% 18.5%
17    (32, 171)       1.0      1.0    85.96 259,292.73 159.3% 15.2%
18    (13, 156)       4.0      4.0   362.38 243,928.41 143.9% 17.5%
19     (73, 84)       5.0      6.0   427.50 176,000.45  76.0% 20.8%
20     (77, 82)       8.0      9.0   642.96 173,471.06  73.5% 22.4%
21     (77, 82)       8.0      9.0   642.96 173,471.06  73.5% 22.4%
22     (81, 91)       5.0      6.0   491.77 217,222.67 117.2% 16.7%
23     (76, 81)       8.0      9.0   643.36 171,211.45  71.2% 24.4%
24     (73, 85)       2.0      3.0   220.90 194,837.49  94.8% 19.9%
25    (12, 155)       4.0      4.0   358.07 234,517.54 134.5% 18.5%
26     (76, 84)       7.0      8.0   572.56 181,243.30  81.2% 20.5%
27     (77, 86)       6.0      7.0   564.34 217,678.26 117.7% 18.9%
28     (78, 85)       7.0      8.0   598.97 201,469.22 101.5% 19.2%
29     (80, 86)       8.0      9.0   672.51 198,322.07  98.3% 19.4%

==================END OF REPORT===================
Visualization of parameter optimization results and various indicators:
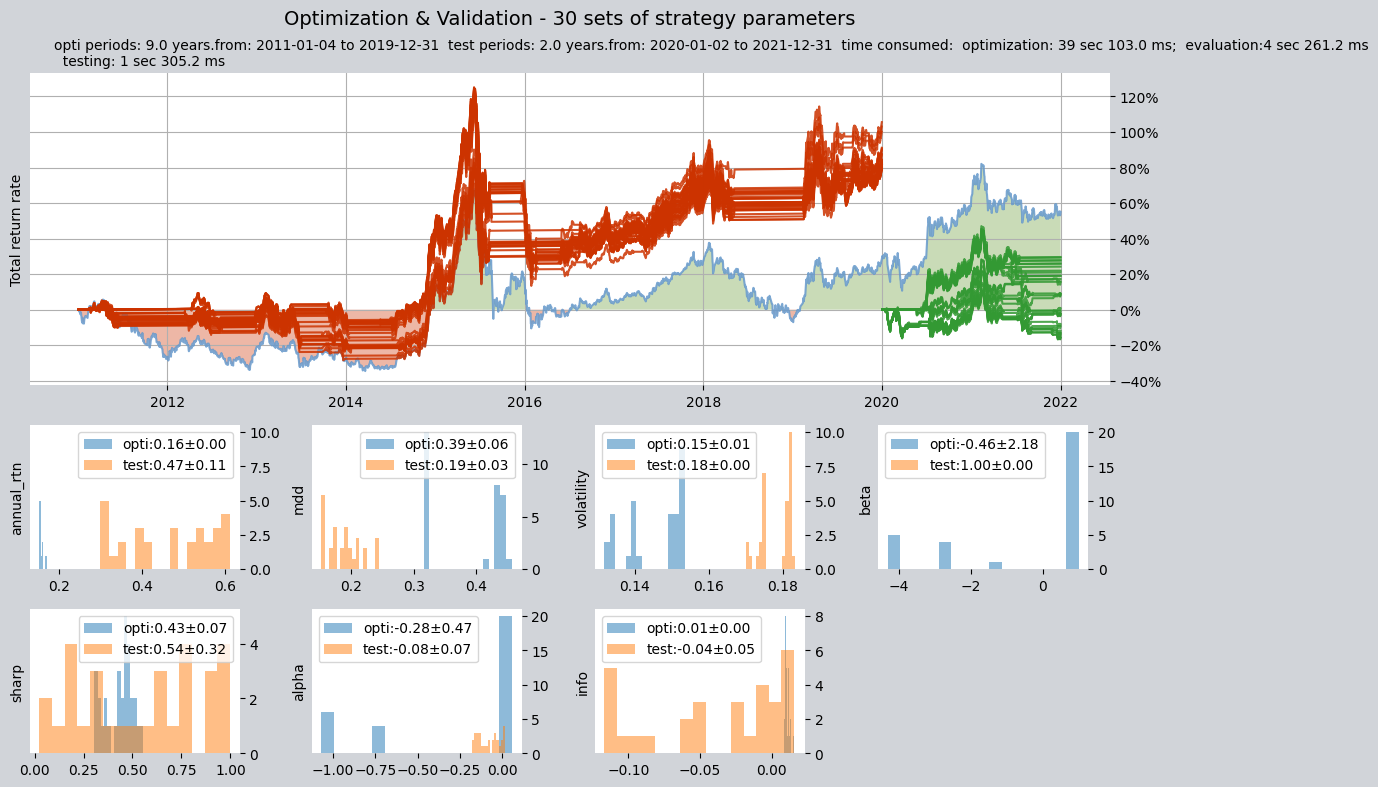
We can check the best parameters found after optimization:
# 从优化结果中取出一组参数试验一下:
op.set_parameter(0,
                 pars= (43, 144)  # 修改策略参数,改为短周期25天,长周期166天
                )

# 重复一次测试,除策略参数意外,其他设置不变
res = qt.run(op,
             mode=1,
             asset_pool='000300.SH',
             invest_start='20110101',
             visual=True
            )
Results obtained:
====================================
| |
| BACKTEST REPORT |
| |
====================================
qteasy running mode: 1 - History back testing
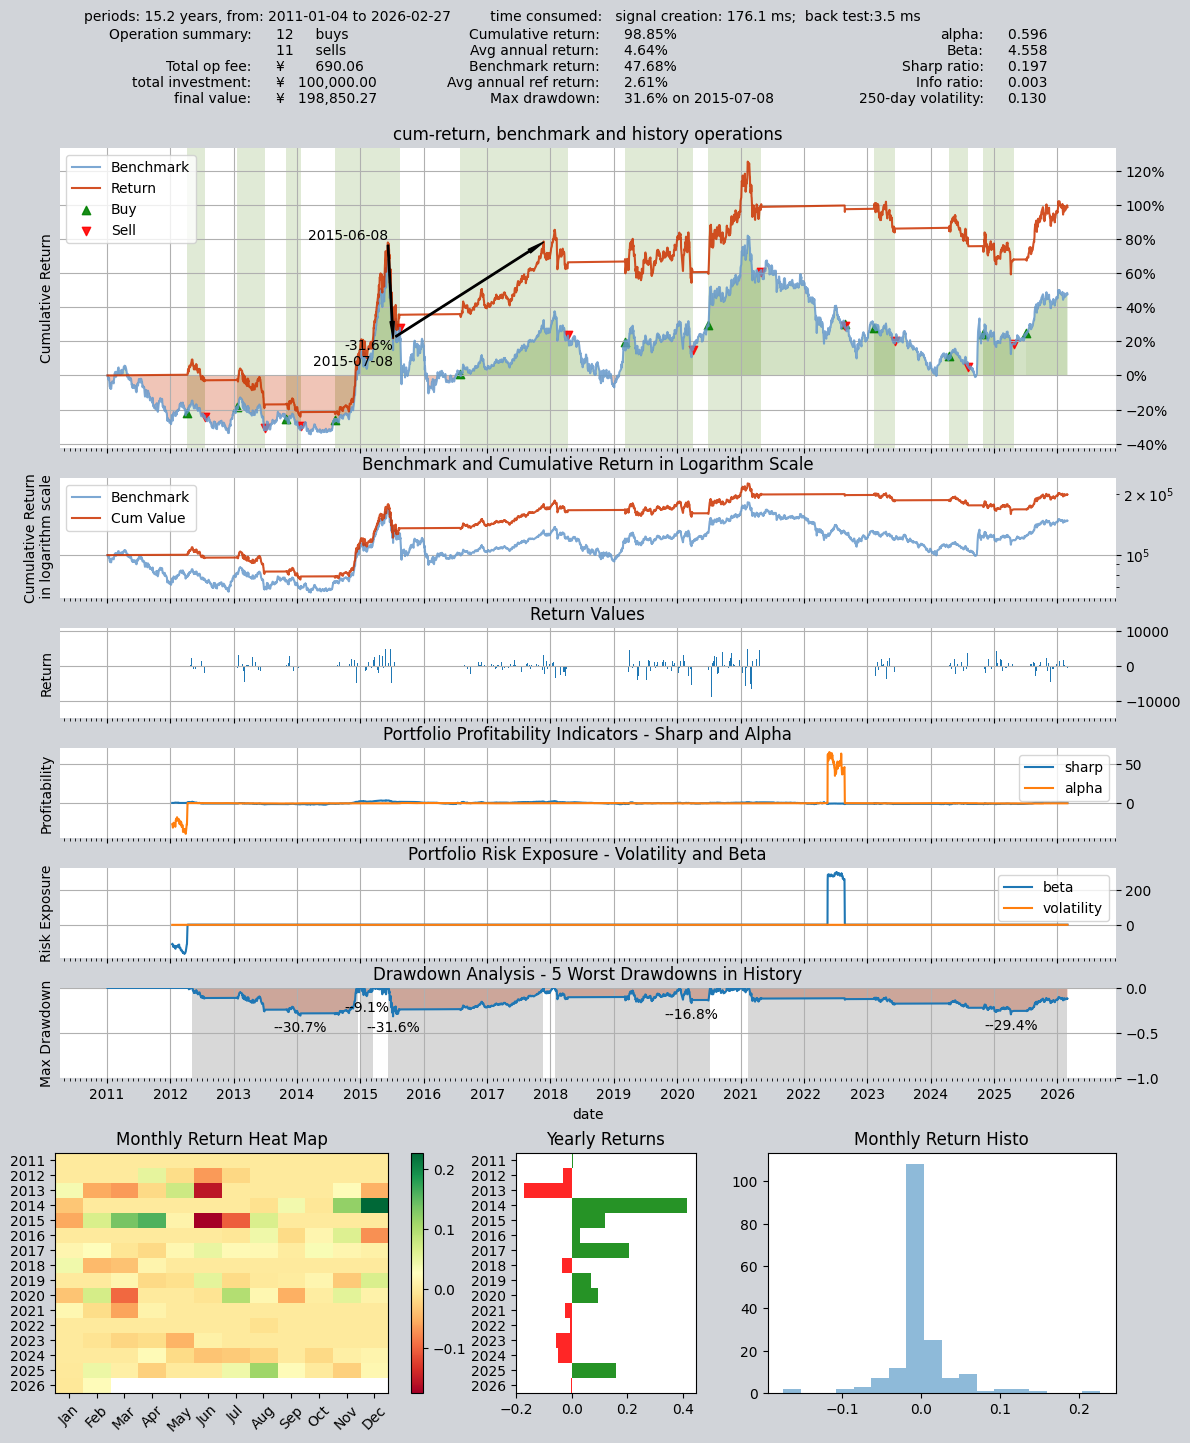
time consumption for operate signal creation: 176.1 ms
time consumption for operation back testing: 3.5 ms
investment starts on 2011-01-04 15:00:00
ends on 2026-02-27 15:00:00
Total looped periods: 15.2 years.
-------------operation summary:------------
Only non-empty shares are displayed, call
"loop_result["oper_count"]" for complete operation summary
Sell Cnt Buy Cnt Total Long pct Short pct Empty pct
000300.SH 11 12 23 69.7% -0.0% 30.3%
Total operation fee: ¥ 690.06
total investment amount: ¥ 100,000.00
final value: ¥ 198,850.27
Total return: 98.85%
Avg Yearly return: 4.64%
Skewness: -0.97
Kurtosis: 15.94
Benchmark return: 47.68%
Benchmark Yearly return: 2.61%
------strategy loop_results indicators------
alpha: 0.596
Beta: 4.558
Sharp ratio: 0.197
Info ratio: 0.003
250 day volatility: 0.130
Max drawdown: 31.58%
peak / valley: 2015-06-08 / 2015-07-08
recovered on: 2017-11-21
==================END OF REPORT===================
The optimized total return rate reached 98.85%, which is much better than the parameters before optimization.
Visualization of the results after optimization: