6. Selección de acciones de índice mejorada
Fuente de referencia: docs/_joinquant_migration_source/Example_06_index-enhanced stock selection.ipynb Primera celda de Markdown.
Esta estrategia sigue los componentes del índice Shanghai y Shenzhen 300 con una ponderación inicial de 0,8. El porcentaje de acciones individuales es (0,8 * peso de las acciones constituyentes) * 100%. Luego, según si las acciones individuales: 1. subieron durante 5 días consecutivos 2. cayeron durante 5 días consecutivos, para determinar si las acciones individuales son acciones fuertes o acciones débiles y ajustar sus ponderaciones de 0,8 a 1,0 o 0,6.
Frecuencia de ejecución de la estrategia: operación diaria Hora de operación de la estrategia: antes del cierre de cada día
Hora de prueba retrospectiva: 2021-01-01 al 2022-12-31
6.1. 1. 策略代码
Cree una estrategia comercial personalizada:
import qteasy as qt
import numpy as np
from qteasy import Parameter, StgData


class IndexEnhancement(qt.GeneralStg):

    def __init__(self):
        super().__init__(
                pars=[
                    Parameter((0.01, 0.99), name='weight_threshold', par_type='float', value=0.35),
                    Parameter((0.51, 0.99), name='init_weight', par_type='float', value=0.8),
                    Parameter((2, 20), name='price_days', par_type='int', value=5),
                ],
                name='IndexEnhancement',
                description='跟踪HS300指数选股,并根据连续上涨/下跌趋势判断强弱势以增强权重',
                data_types=[
                    StgData('wt_idx|000300.SH', freq='m', asset_type='E', window_length=2),
                    StgData('close', freq='d', asset_type='E', window_length=40),
                ],
        )

    def realize(self):
        weight_threshold, init_weight, price_days = self.get_pars('weight_threshold', 'init_weight', 'price_days')
        # 读取投资组合的权重wt和最近price_days天的收盘价
        wt = self.get_data('wt_idx|000300.SH_E_m')[-1]
        close_windows = self.get_data('close_E_d')
        pre_close = close_windows[-price_days - 1:-1]
        close = close_windows[-price_days:]  # 当前所有股票的最新连续收盘价

        # 计算连续price_days天的收益
        stock_returns = close - pre_close

        # 设置初始选股权重为0.8
        weights = init_weight * np.ones_like(wt)

        # 剔除掉权重小于weight_threshold的股票
        weights[wt < weight_threshold] = 0

        # 找出强势股,将其权重设为1, 找出弱势股,将其权重设置为 init_weight - (1 - init_weight)
        up_trends = np.all(stock_returns > 0, axis=1)
        weights[up_trends] = 1.0
        down_trend_weight = init_weight - (1 - init_weight)
        down_trends = np.all(stock_returns < 0, axis=1)
        weights[down_trends] = down_trend_weight

        # 实际选股权重为weights * HS300权重
        weights *= wt

        return weights
6.2. 2. 策略回测
Parámetros de prueba retrospectiva:
Hora de prueba retrospectiva: 2021-01-01 al 2022-12-31
Tipo de activo: acciones
Conjunto de activos: Shanghai y Shenzhen 300 constituyentes
Inversión inicial: 1 millón
Lote de compra: 100 acciones
Vender lote: 1 acción
shares = qt.filter_stock_codes(index='000300.SH', date='20210101')
print(len(shares), shares[:10])
alpha = IndexEnhancement()
op = qt.Operator(alpha, signal_type='PT')
op.op_type = 'stepwise'
op.set_blender('1.0*s0')
res = qt.run(op, mode=1,
       invest_start='20210101',
       invest_end='20221231',
       invest_cash_amounts=[1000000],
       asset_type='E',
       asset_pool=shares,
       trade_batch_size=100,
       sell_batch_size=1,
       trade_log=True,
      )

print()
6.3. Resultados de la prueba retrospectiva
419 ['000001.SZ', '000002.SZ', '000063.SZ', '000066.SZ', '000069.SZ', '000100.SZ', '000157.SZ', '000166.SZ', '000333.SZ', '000338.SZ']
No match found! To get better result, you can
- pass "match_full_name=True" to match full names of stocks and funds
====================================
| |
| BACK TESTING RESULT |
| |
====================================
qteasy running mode: 1 - History back testing
time consumption for operate signal creation: 0.0 ms
time consumption for operation back looping: 13 sec 461.8 ms
investment starts on 2021-01-04 00:00:00
ends on 2022-12-30 00:00:00
Total looped periods: 2.0 years.
-------------operation summary:------------
Only non-empty shares are displayed, call
"loop_result["oper_count"]" for complete operation summary
Sell Cnt Buy Cnt Total Long pct Short pct Empty pct
000001.SZ 0 3 3 100.0% 0.0% 0.0%
000002.SZ 0 2 2 100.0% 0.0% 0.0%
000063.SZ 0 0 0 100.0% 0.0% 0.0%
000100.SZ 1 5 6 66.9% 0.0% 33.1%
000333.SZ 0 1 1 100.0% 0.0% 0.0%
000338.SZ 1 1 2 62.3% 0.0% 37.7%
000651.SZ 0 1 1 100.0% 0.0% 0.0%
000725.SZ 0 95 95 100.0% 0.0% 0.0%
000858.SZ 0 0 0 100.0% 0.0% 0.0%
002027.SZ 1 3 4 62.3% 0.0% 37.7%
... ... ... ... ... ... ...
601229.SH 1 3 4 50.2% 0.0% 49.8%
601288.SH 0 76 76 100.0% 0.0% 0.0%
601318.SH 0 3 3 100.0% 0.0% 0.0%
601328.SH 0 30 30 100.0% 0.0% 0.0%
601398.SH 0 106 106 100.0% 0.0% 0.0%
601601.SH 1 0 1 78.8% 0.0% 21.2%
601668.SH 0 15 15 100.0% 0.0% 0.0%
601688.SH 0 1 1 100.0% 0.0% 0.0%
601899.SH 0 4 4 100.0% 0.0% 0.0%
603259.SH 0 0 0 100.0% 0.0% 0.0%
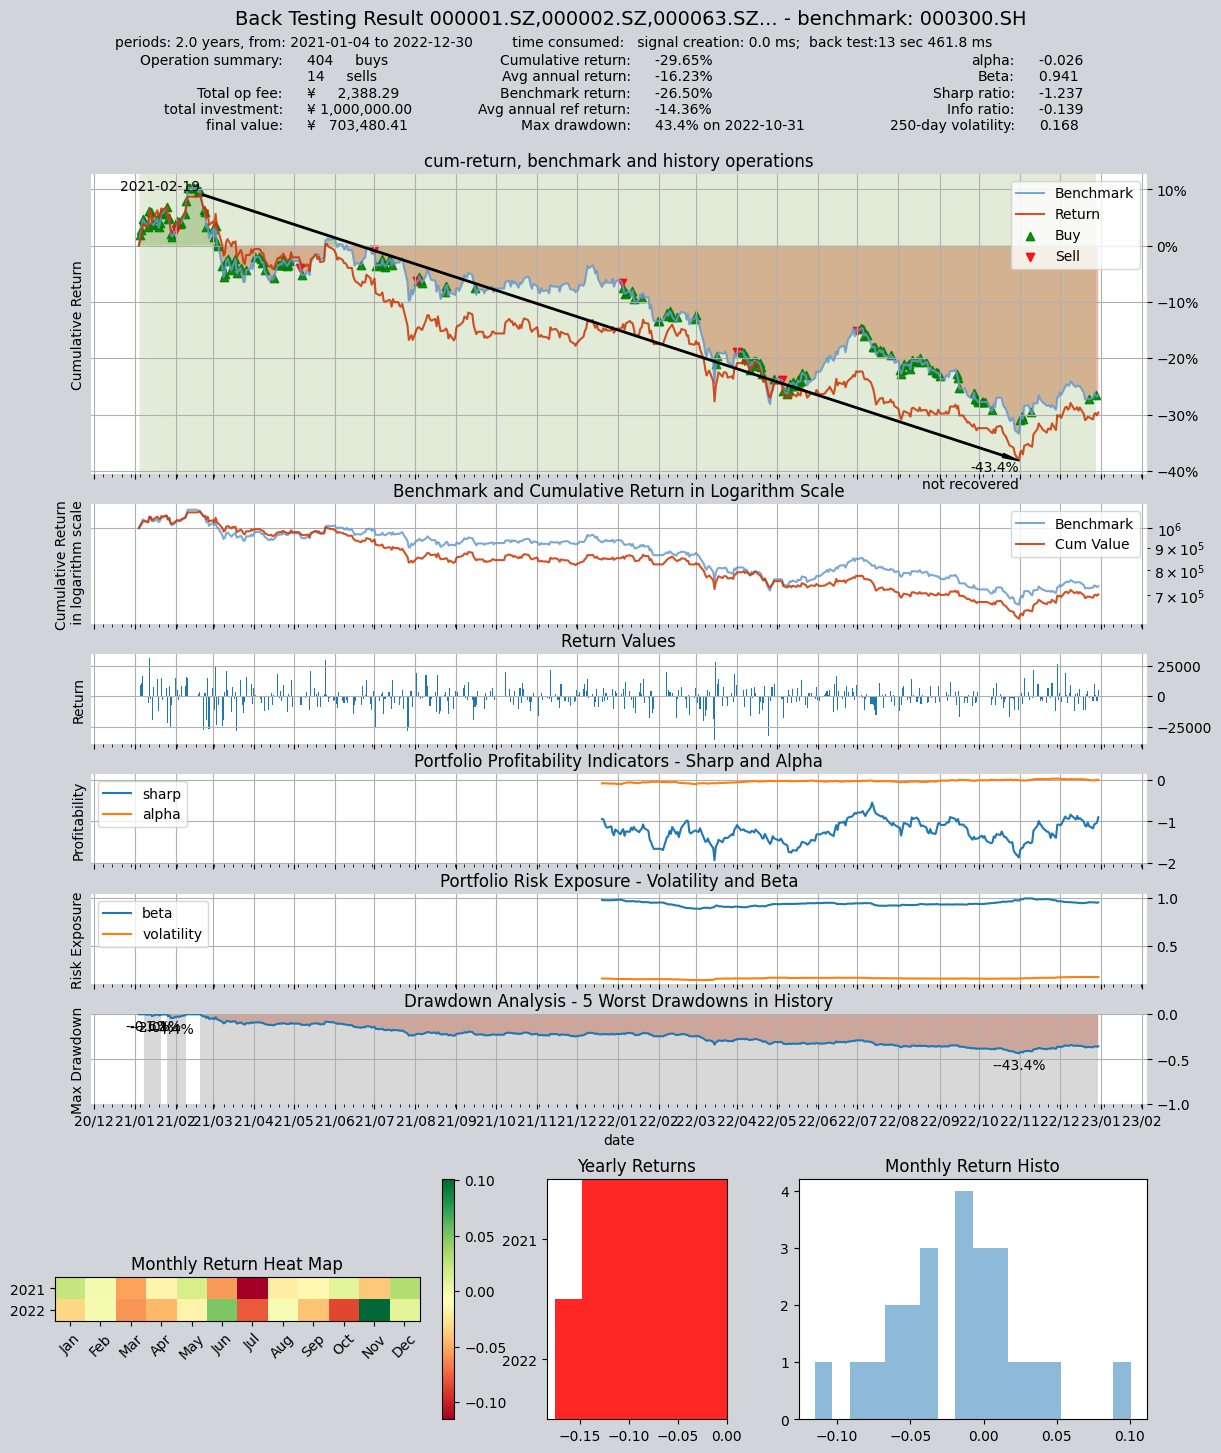
Total operation fee: ¥ 2,388.29
total investment amount: ¥1,000,000.00
final value: ¥ 703,480.41
Total return: -29.65%
Avg Yearly return: -16.23%
Skewness: -0.02
Kurtosis: 1.63
Benchmark return: -26.50%
Benchmark Yearly return: -14.36%
------strategy loop_results indicators------
alpha: -0.026
Beta: 0.941
Sharp ratio: -1.237
Info ratio: -0.139
250 day volatility: 0.168
Max drawdown: 43.41%
peak / valley: 2021-02-19 / 2022-10-31
recovered on: Not recovered!
===========END OF REPORT=============