1. ダブル MA タイミング
参照元:docs/_joinquant_migration_source/Example_01_Double Moving Average Timing Strategy.ipynb 最初のMarkdownセル。
この戦略は、取引対象の毎日の K ライン データに基づいて 2 重移動平均取引モデルを確立し、取引戦略は次のとおりです。
この戦略には、短期期間の日数 S と長期期間の日数 L の 2 つのパラメーターが含まれています。 2 つの異なる期間で取引対象の日次 K ラインの終値の移動平均を計算し、2 つの移動平均を取得します。 Sを周期として算出した移動平均が高速移動平均となり、Lを周期として算出した移動平均が低速移動平均となります。高速移動平均と低速移動平均のクロス状況に応じて取引シグナルを生成します。
速い移動平均が遅い移動平均を下から上に横切ると、取引ターゲットは完全に買われます。
高速移動平均が短期移動平均を上から下に横切ると、ポジションを決済します。
バックテスト取引のシミュレーション:
バックテストデータ:上海・深セン300指数(000300.SH)
バックテスト期間:2011年1月1日~2020年12月31日
取引結果チャートの生成
戦略パラメータの最適化:
2011 年から 2020 年までの 10 年間の HS300 インデックスを使用して、最適な戦略パラメーターを検索します。
2020 年から 2022 年のデータでテスト
最適な 30 個のパラメータのテスト結果を出力
1.1. まず、qteasy モジュールをインポートします。
import qteasy as qt
1.2. 新しい戦略を立てる
qt.RuleIterator ストラテジー基本クラスを使用して、ルール反復ストラテジーを作成します。この戦略は、ポートフォリオ内のすべての株式に同じルールの反復を適用できます。これは、ポートフォリオ内のすべての株式に同じタイミング ルールを適用するのに適しています。
from qteasy import Parameter, StgData
from qteasy import RuleIterator
# 创建双均线交易策略类
class Cross_SMA_PS(RuleIterator):
    """自定义双均线择时策略策略,产生的信号类型为交易信号
        这个均线择时策略有两个参数:
            - FMA 快均线周期
            - SMA 慢均线周期
        策略跟踪上述两个周期产生的简单移动平均线,当两根均线发生交叉时
        直接产生交易信号。
    """
    def __init__(self, **kwargs):
        """
        初始化交易策略的参数信息和基本信息
        """
        super().__init__(
            pars=[Parameter((10, 100), name='fast', par_type='int', value=10),
                  Parameter((30, 180), name='slow', par_type='int', value=160)],
            # 策略只有长短周期两个参数, 均为整型变量
            name='CROSSLINE',  # 策略的名称
            description='快慢双均线择时策略',  # 策略的描述
            data_types=StgData('close', freq='d', asset_type='ANY', window_length=200),  # 策略基于收盘价计算均线,因此数据类型为'close', 历史数据窗口长度为200
            **kwargs,
        )

    def realize(self):
        """策略的具体实现代码:
         - f: fast, 短均线计算日期;
         - s: slow: 长均线计算日期;
        """
        from qteasy.tafuncs import sma
        # 获取传入的策略参数
        f, s = self.get_pars('fast', 'slow')
        # 获取历史数据日频收盘价,计算长短均线的当前值和昨天的值
        close = self.get_data('close_ANY_d')
        # 使用qt.sma计算简单移动平均价
        s_ma = sma(close, s)
        f_ma = sma(close, f)

        # 为了考察两条均线的交叉, 计算两根均线昨日和今日的值,以便判断
        s_today, s_last = s_ma[-1], s_ma[-2]
        f_today, f_last = f_ma[-1], f_ma[-2]

        # 根据观望模式在不同的点位产生交易信号
        # 在PS信号类型下,1表示全仓买入,-1表示卖出全部持有股份
        # 当快均线自下而上穿过上边界,发出全仓买入信号
        if (f_last <= s_last) and (f_today >= s_today):
            return 1
        # 当快均线自上而下穿过上边界,发出全部卖出信号
        elif (f_last >= s_last) and (f_today <= s_today):
            return -1
        else:  # 其余情况不产生任何信号
            return 0
1.3. 取引戦略をバックテストし、結果を表示する
戦略を定義した後、作成したばかりの戦略を参照する Operator オブジェクトを定義します。ストラテジーのルールに従って、トレーダーのシグナルモードをPSに設定します。 PS は比例取引シグナルを表します。このモードでは、シグナルの範囲は -1 から 1 で、1 は完全な買いを表し、-1 は完全な売りを表し、0 はアクションがないことを表します。過去のデータを使用して取引戦略をバックテストします。履歴データを使用して取引シグナルを生成した後、シミュレーション取引を実行し、取引結果を記録および分析します。
stg = Cross_SMA_PS()
op = qt.Operator([stg], signal_type='PS')

# 设置op的策略参数
op.set_parameter(0, par_values= (10, 160))  # 设置快慢均线周期分别为10天、166天
op.set_group_parameters('Group_1', blender_str='s0')
# 设置基本回测参数,开始运行模拟交易回测
res = qt.run(op,
             mode=1,  # 运行模式为回测模式
             asset_pool='000300.SH',  # 投资标的为000300.SH即沪深300指数
             invest_start='20110101',  # 回测开始日期
             visual=True,  # 生成交易回测结果分析图
             trade_batch_size=0.01,
             sell_batch_size=0.01,
            )
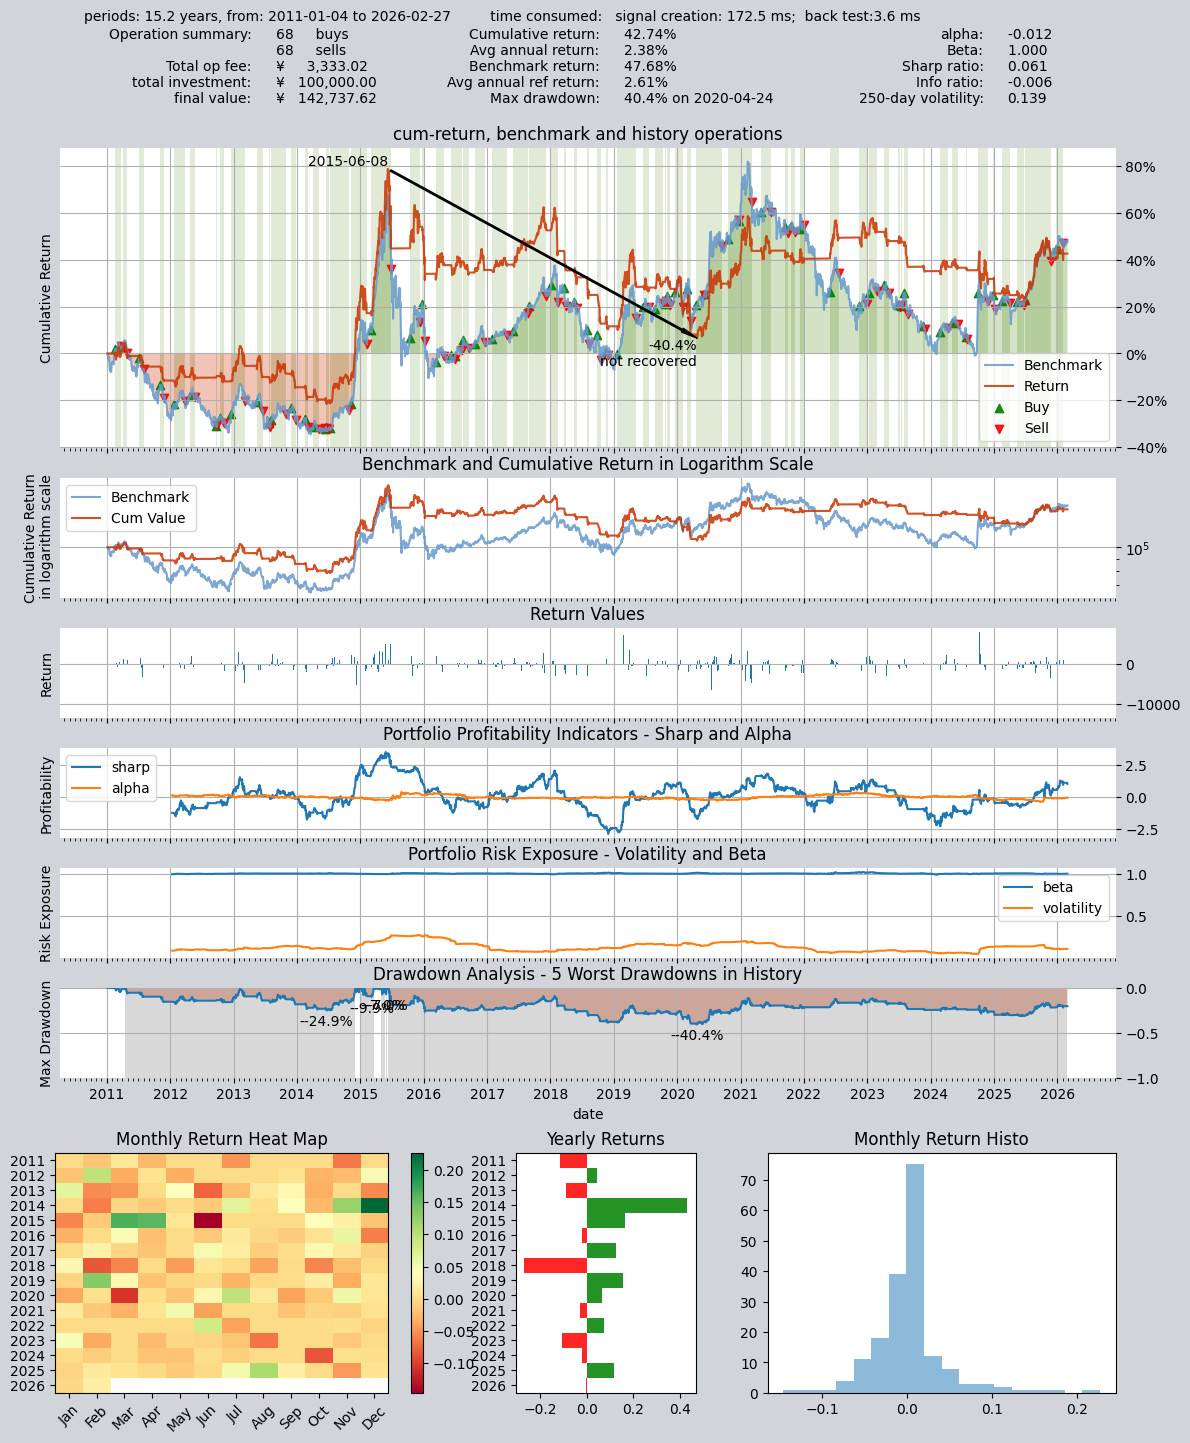
取引結果は以下の通りです。
====================================
|                                  |
|         BACKTEST REPORT          |
|                                  |
====================================
qteasy running mode: 1 - History back testing
time consumption for operate signal creation: 172.5 ms
time consumption for operation back testing:  3.6 ms
investment starts on      2011-01-04 15:00:00
ends on                   2026-02-27 15:00:00
Total looped periods:     15.2 years.
-------------operation summary:------------
Only non-empty shares are displayed, call
"loop_result["oper_count"]" for complete operation summary
          Sell Cnt Buy Cnt Total Long pct Short pct Empty pct
000300.SH    68       68    136   55.2%     -0.0%     44.8%

Total operation fee:     ¥    3,333.02
total investment amount: ¥  100,000.00
final value:              ¥  142,737.62
Total return:                    42.74%
Avg Yearly return:                2.38%
Skewness:                         -0.91
Kurtosis:                         13.80
Benchmark return:                47.68%
Benchmark Yearly return:          2.61%

------strategy loop_results indicators------
alpha:                           -0.012
Beta:                             1.000
Sharp ratio:                      0.061
Info ratio:                      -0.006
250 day volatility:               0.139
Max drawdown:                    40.45%
    peak / valley:        2015-06-08 / 2020-04-24
    recovered on:         Not recovered!


==================END OF REPORT===================
上記の取引結果からわかるように、10年間で68回の買いと68回の売りがあり、保有期間は55%で、最終的なリターンはわずか42.7%でした。
こちらは取引結果を視覚的に表示したものです
クロスライン取引戦略は長期と短期の期間を選択することが非常に重要です。qteasy を使用して最適な戦略パラメーターを検索できます。
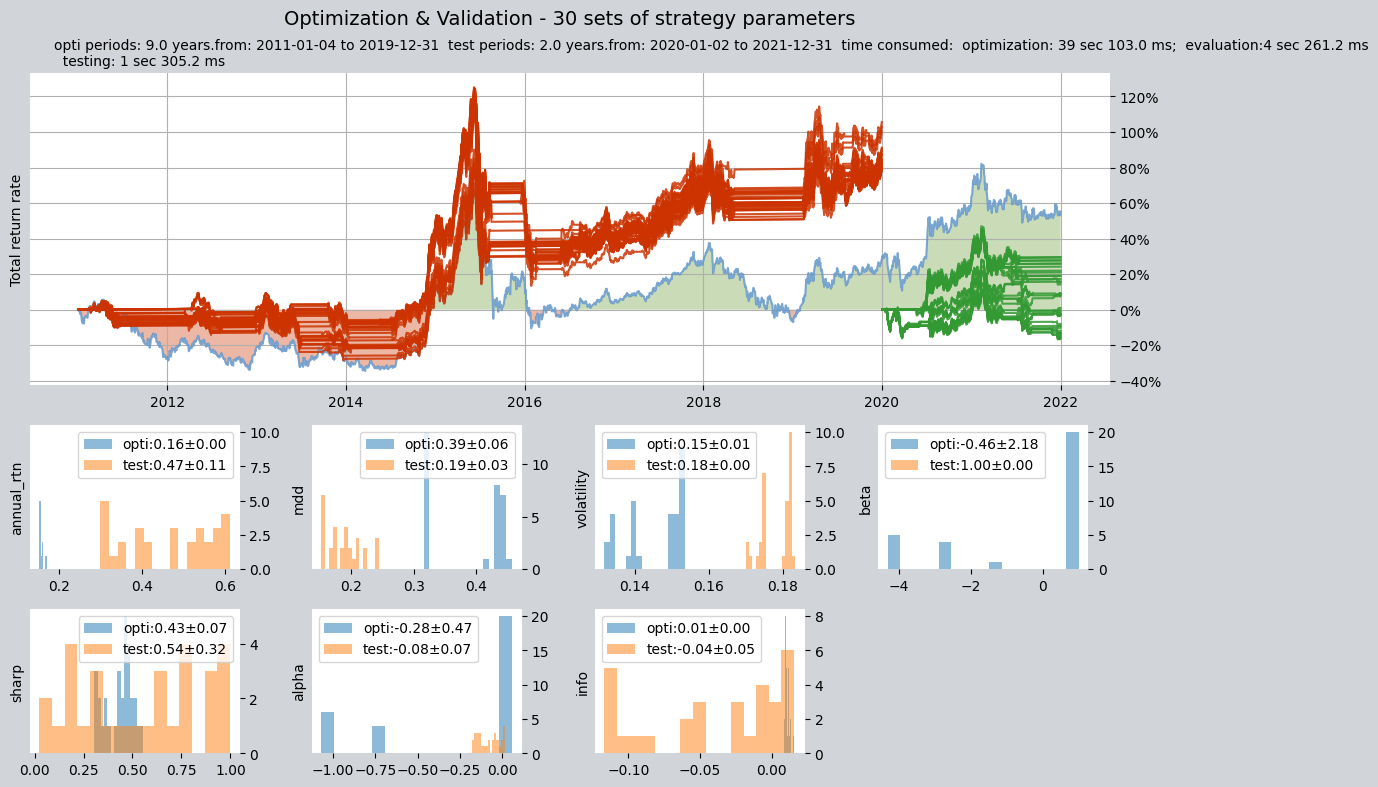
1.4. 戦略パラメータの最適化
履歴データで最適なポリシー パラメーターを検索し、履歴データで最高のパフォーマンスを発揮するパラメーターの組み合わせを見つけ、独立したテスト間隔でパフォーマンスを調べて過剰適合をチェックできます。
op.set_parameter(0,
                 opt_tag=1  # 将op中的策略设置为可优化,如果不这样设置,将无法优化策略参数
                )
res = qt.run(op,
             mode=2,
             opti_start='20110101',  # 优化区间开始日期
             opti_end='20200101',  # 优化区间结束日期
             test_start='20200101',  # 独立测试开始日期
             test_end='20220101',  # 独立测试结束日期
             opti_sample_count=1000,  # 一共进行1000次搜索
             opti_method='SA',  # 优化方法为模拟退火算法
             parallel=False,  # 不启用并行搜索
            )
戦略の最適化には長い時間がかかる場合があり、qt には進行状況バーが表示されます。
Epoch:1/5->175917.941: 100%|█████████████████████████████████████████████████| 128/128 [00:08<00:00, 15.94it/s]
Epoch:2/5->183493.313: 100%|█████████████████████████████████████████████████| 128/128 [00:07<00:00, 16.43it/s]
Epoch:3/5->203089.648: 100%|█████████████████████████████████████████████████| 128/128 [00:07<00:00, 16.59it/s]
Epoch:4/5->187650.270: 100%|█████████████████████████████████████████████████| 128/128 [00:07<00:00, 16.46it/s]
Epoch:5/5->205538.237: 100%|█████████████████████████████████████████████████| 128/128 [00:07<00:00, 16.57it/s]
Epoch:1/1->411083.340: 100%|███████████████████████████████████████████████████| 30/30 [00:04<00:00,  7.04it/s]
最適化が完了し、最適な 30 セットのパラメーターと関連情報が表示されます。
====================================
|                                  |
|       OPTIMIZATION REPORT        |
|                                  |
====================================
qteasy running mode: 2 - Strategy Parameter Optimization
time consumption for optimization: 39 sec 103.0 ms
time consumption for evaluation:   4 sec 261.2 ms
investment starts on 2011-01-04 15:00:00
ends on 2019-12-31 15:00:00
Total looped periods: 9.0 years.
total investment amount: ¥   100,000.00
Benchmark type is 000300.SH
Total Benchmark rtn: 28.43%
Average Yearly Benchmark rtn rate: 2.82%
Statistical analysis of optimal strategy messages indicators:
Total return:        270.25% ± 13.73%
Annual return:       15.66% ± 0.46%
Alpha:               -0.277 ± 0.466
Beta:                -0.459 ± 2.175
Sharp ratio:         0.434 ± 0.069
Info ratio:          0.011 ± 0.002
250 day volatility:  0.145 ± 0.008
Other messages indicators are listed in below table
   Strategy items Sell-outs Buy-ins ttl-fee      FV      ROI    MDD
0     (43, 144)       5.0      6.0    509.43 358,315.55 258.3% 31.6%
1     (29, 171)       5.0      6.0    498.98 358,659.37 258.7% 31.6%
2      (72, 84)      17.0     18.0  1,786.90 359,602.66 259.6% 43.8%
3      (72, 84)      17.0     18.0  1,786.90 359,602.66 259.6% 43.8%
4     (35, 151)       5.0      6.0    510.77 360,689.42 260.7% 31.6%
5      (77, 81)      29.0     30.0  3,111.64 362,208.28 262.2% 44.0%
6      (77, 81)      29.0     30.0  3,111.64 362,208.28 262.2% 44.0%
7      (80, 91)      15.0     16.0  1,519.87 362,252.85 262.3% 45.8%
8     (24, 176)       5.0      6.0    505.68 362,696.68 262.7% 31.6%
9     (24, 176)       5.0      6.0    505.68 362,696.68 262.7% 31.6%
10    (36, 150)       5.0      6.0    510.71 362,666.50 262.7% 31.6%
11    (11, 156)      11.0     12.0  1,005.55 362,714.28 262.7% 31.9%
12     (58, 83)      12.0     13.0  1,218.41 363,195.61 263.2% 43.2%
13    (31, 169)       6.0      7.0    566.80 363,756.82 263.8% 31.6%
14    (36, 151)       5.0      6.0    514.33 364,408.58 264.4% 31.6%
15    (28, 173)       5.0      6.0    505.27 365,648.99 265.6% 31.6%
16     (73, 83)      16.0     17.0  1,678.20 366,055.42 266.1% 43.6%
17    (32, 171)       4.0      5.0    452.30 366,955.25 267.0% 31.6%
18    (13, 156)      10.0     11.0    903.07 367,001.52 267.0% 31.8%
19     (73, 84)      17.0     18.0  1,767.40 368,221.99 268.2% 43.8%
20     (77, 82)      25.0     26.0  2,725.38 368,871.74 268.9% 44.7%
21     (77, 82)      25.0     26.0  2,725.38 368,871.74 268.9% 44.7%
22     (81, 91)      15.0     16.0  1,560.50 374,068.95 274.1% 44.4%
23     (76, 81)      25.0     26.0  2,730.01 375,311.56 275.3% 43.9%
24     (73, 85)      16.0     17.0  1,708.08 379,569.28 279.6% 44.0%
25    (12, 155)      11.0     12.0    992.25 381,190.46 281.2% 31.6%
26     (76, 84)      21.0     22.0  2,181.56 382,247.74 282.2% 44.6%
27     (77, 86)      16.0     17.0  1,719.80 400,385.81 300.4% 43.2%
28     (78, 85)      22.0     23.0  2,393.91 406,202.21 306.2% 43.2%
29     (80, 86)      21.0     22.0  2,386.87 411,083.34 311.1% 41.6%

==================END OF REPORT===================
これら 30 セットのパラメーターは、過学習かどうかを確認するための独立したテストに使用されます。
Epoch:1/1->259292.734: 100%|███████████████████████████████████████████████████████████| 30/30 [00:01<00:00, 23.02it/s]

====================================
|                                  |
|        VALIDATION REPORT         |
|                                  |
====================================
qteasy running mode: 2 - Strategy Parameter Optimization
time consumption for optimization: 39 sec 103.0 ms
time consumption for evaluation:   4 sec 261.2 ms
investment starts on 2020-01-02 15:00:00
ends on 2021-12-31 15:00:00
Total looped periods: 2.0 years.
total investment amount: ¥   100,000.00
Benchmark type is 000300.SH
Total Benchmark rtn: 18.98%
Average Yearly Benchmark rtn rate: 9.09%
Statistical analysis of optimal strategy messages indicators:
Total return:        115.83% ± 31.89%
Annual return:       46.59% ± 10.98%
Alpha:               -0.081 ± 0.066
Beta:                0.999 ± 0.000
Sharp ratio:         0.545 ± 0.322
Info ratio:          -0.038 ± 0.047
250 day volatility:  0.178 ± 0.004
Other messages indicators are listed in below table
   Strategy items Sell-outs Buy-ins ttl-fee     FV      ROI    MDD
0     (43, 144)       1.0      1.0    84.86 248,458.67 148.5% 15.2%
1     (29, 171)       1.0      1.0    85.88 258,545.09 158.5% 15.2%
2      (72, 84)       2.0      3.0   224.59 195,264.51  95.3% 20.8%
3      (72, 84)       2.0      3.0   224.59 195,264.51  95.3% 20.8%
4     (35, 151)       3.0      3.0   282.50 241,963.33 142.0% 17.0%
5      (77, 81)      10.0     11.0   792.08 168,647.51  68.6% 24.3%
6      (77, 81)      10.0     11.0   792.08 168,647.51  68.6% 24.3%
7      (80, 91)       4.0      5.0   412.29 218,152.13 118.2% 16.7%
8     (24, 176)       1.0      1.0    85.21 251,880.99 151.9% 15.2%
9     (24, 176)       1.0      1.0    85.21 251,880.99 151.9% 15.2%
10    (36, 150)       3.0      3.0   279.96 238,065.57 138.1% 17.3%
11    (11, 156)       5.0      5.0   448.16 231,744.72 131.7% 19.1%
12     (58, 83)       3.0      4.0   346.95 230,754.45 130.8% 19.8%
13    (31, 169)       1.0      1.0    85.55 255,239.86 155.2% 15.2%
14    (36, 151)       3.0      3.0   279.98 238,344.64 138.3% 17.2%
15    (28, 173)       1.0      1.0    85.59 255,731.20 155.7% 15.2%
16     (73, 83)       6.0      7.0   503.93 183,585.71  83.6% 18.5%
17    (32, 171)       1.0      1.0    85.96 259,292.73 159.3% 15.2%
18    (13, 156)       4.0      4.0   362.38 243,928.41 143.9% 17.5%
19     (73, 84)       5.0      6.0   427.50 176,000.45  76.0% 20.8%
20     (77, 82)       8.0      9.0   642.96 173,471.06  73.5% 22.4%
21     (77, 82)       8.0      9.0   642.96 173,471.06  73.5% 22.4%
22     (81, 91)       5.0      6.0   491.77 217,222.67 117.2% 16.7%
23     (76, 81)       8.0      9.0   643.36 171,211.45  71.2% 24.4%
24     (73, 85)       2.0      3.0   220.90 194,837.49  94.8% 19.9%
25    (12, 155)       4.0      4.0   358.07 234,517.54 134.5% 18.5%
26     (76, 84)       7.0      8.0   572.56 181,243.30  81.2% 20.5%
27     (77, 86)       6.0      7.0   564.34 217,678.26 117.7% 18.9%
28     (78, 85)       7.0      8.0   598.97 201,469.22 101.5% 19.2%
29     (80, 86)       8.0      9.0   672.51 198,322.07  98.3% 19.4%

==================END OF REPORT===================
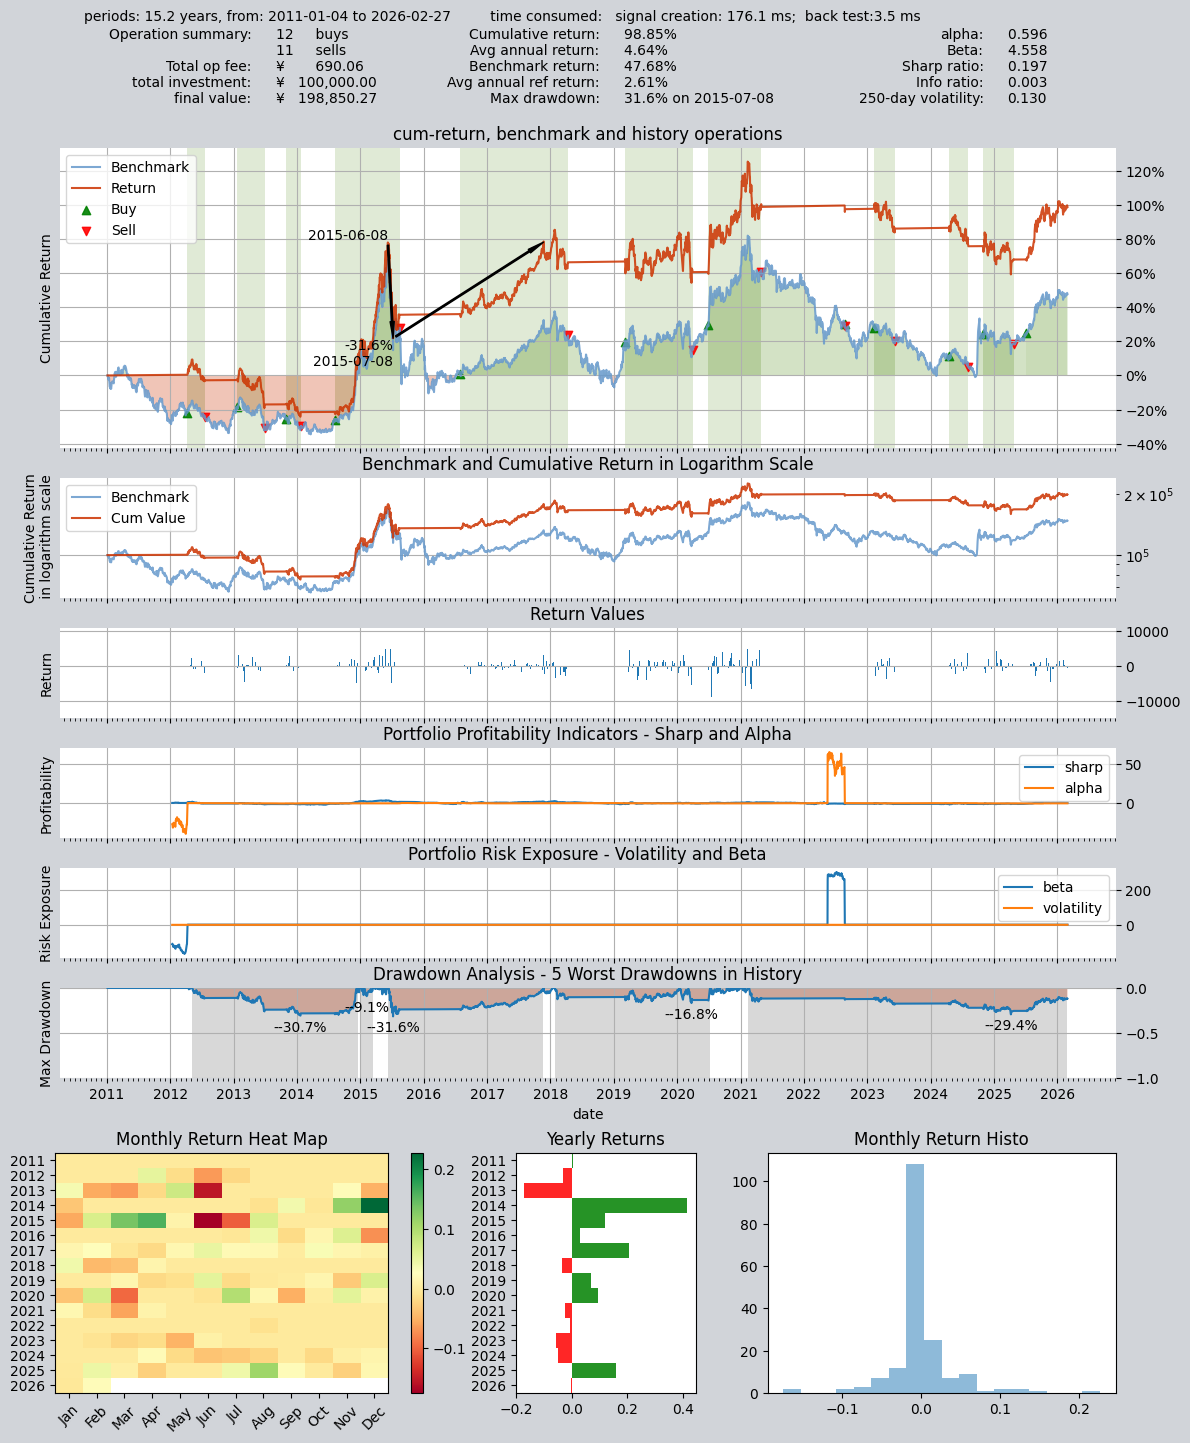
パラメータの最適化結果と各種指標の可視化:
最適化後に見つかった最適なパラメーターを確認できます。
# 从优化结果中取出一组参数试验一下:
op.set_parameter(0,
                 pars= (43, 144)  # 修改策略参数,改为短周期25天,长周期166天
                )

# 重复一次测试,除策略参数意外,其他设置不变
res = qt.run(op,
             mode=1,
             asset_pool='000300.SH',
             invest_start='20110101',
             visual=True
            )
得られた結果:
====================================
|                                  |
|         BACKTEST REPORT          |
|                                  |
====================================
qteasy running mode: 1 - History back testing
time consumption for operate signal creation: 176.1 ms
time consumption for operation back testing:  3.5 ms
investment starts on      2011-01-04 15:00:00
ends on                   2026-02-27 15:00:00
Total looped periods:     15.2 years.
-------------operation summary:------------
Only non-empty shares are displayed, call
"loop_result["oper_count"]" for complete operation summary
          Sell Cnt Buy Cnt Total Long pct Short pct Empty pct
000300.SH    11       12     23   69.7%     -0.0%     30.3%

Total operation fee:     ¥      690.06
total investment amount: ¥  100,000.00
final value:              ¥  198,850.27
Total return:                    98.85%
Avg Yearly return:                4.64%
Skewness:                         -0.97
Kurtosis:                         15.94
Benchmark return:                47.68%
Benchmark Yearly return:          2.61%

------strategy loop_results indicators------
alpha:                            0.596
Beta:                             4.558
Sharp ratio:                      0.197
Info ratio:                       0.003
250 day volatility:               0.130
Max drawdown:                    31.58%
    peak / valley:        2015-06-08 / 2015-07-08
    recovered on:         2017-11-21


==================END OF REPORT===================
最適化された総収益率は 98.85% に達し、最適化前のパラメーターよりも大幅に向上しました。
最適化後の結果の視覚化: